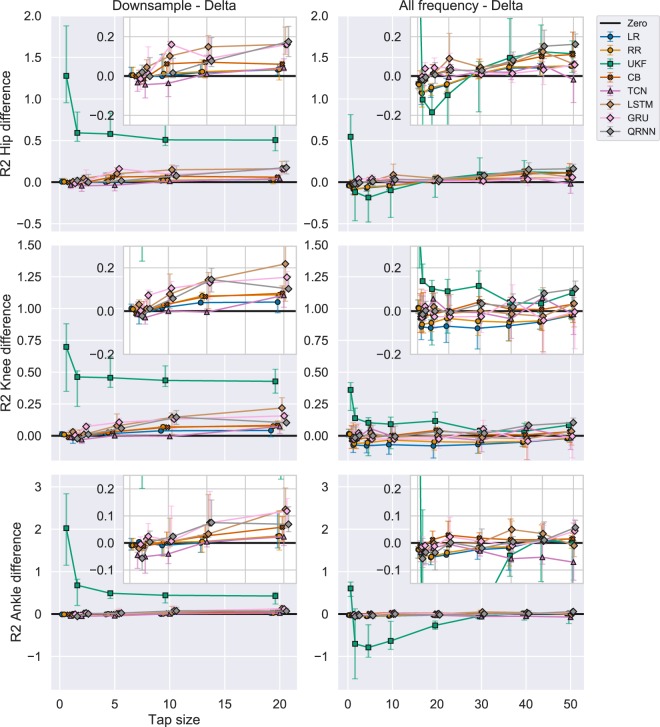
Figure 7.
R2 difference with UKF between (1) Downsample vs Delta and (2) All frequency vs Delta. Each row represents different joint angles for the right leg and each column represents the differences between (1) Experiment 2 vs (1, 2) Experiment 3 vs 1 in performance (R2 score). The black line shows a zero threshold to indicate which experiment performed better at a certain tap sizes. Similar algorithms were grouped using shapes. The errorbar shows 25th to 75th percentile and the middle marker shows the median value. The inset figures show a magnified view to compare different algorithms other than the UKF. Linear algorithms with a circle (LR: Linear Regression, RR: Ridge Regression), Adaptive filter with a square (UKF: Unscented Kalman Filter), Boosting with a cross (CB: CatBoost), CNN with a triangle (TCN: Temporal Convolutional Network), RNN with a diamond (LSTM: Long Short Term Memory, GRU: Gated Recurrent Unit, QRNN: Quasi-Recurrent Neural Network).

