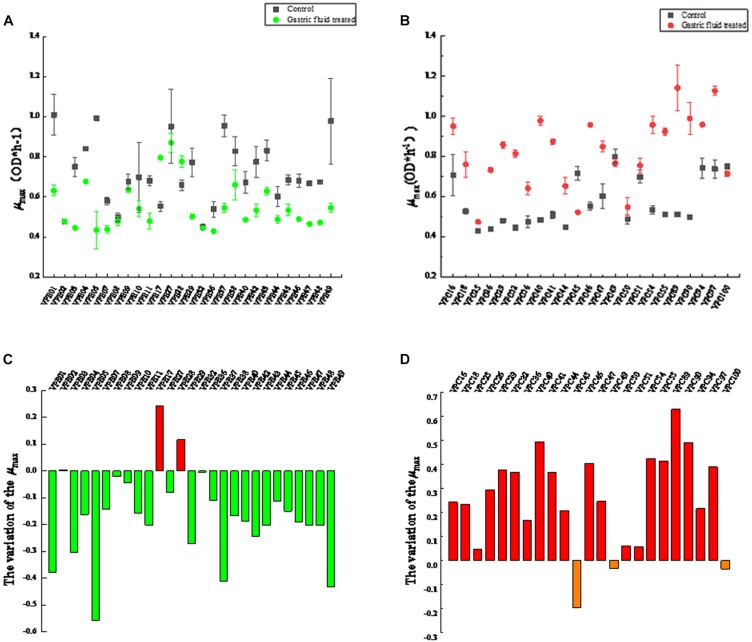
FIGURE 1.
Maximum specific growth rates (μmax) of V. parahaemolyticus strains from different sources after SGF. (A) Maximum specific growth rate of environmental strains. (B) Maximum specific growth rate of pathogenic strains. (C) The change of maximum specific growth rate of environmental strains in SGF treatment. (D) The change of maximum specific growth rate of pathogenic strains in SGF treatment.

