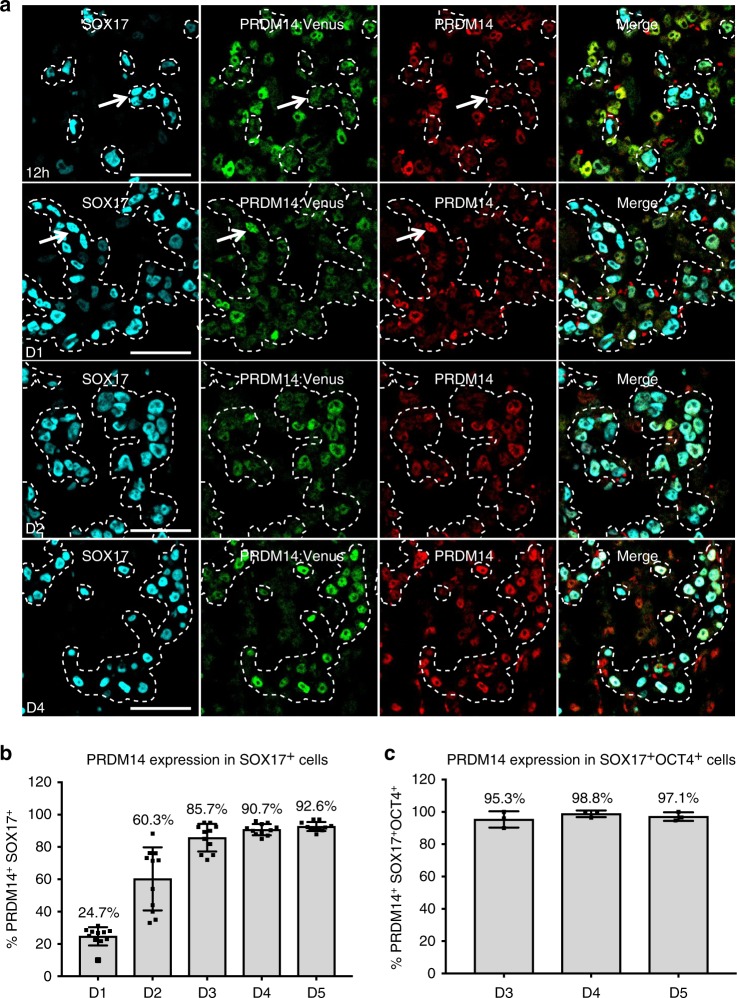
Fig. 2. PRDM14-Venus knock-in reporter detects the dynamics of specific PRDM14 expression in hPGCLCs.
a Time-course IF analysis (representative of two hPGCLC inductions) showing PRDM14 expression in embryoid body (EB) sections throughout hPGCLC specification from PRDM14-AID-Venus fusion reporter cell line. hPGCLCs were induced by cytokines and EBs were collected at 12 h, and on D1-D5. Representative images for 12 h, D1, D2 and D4 are shown. hPGCLCs were marked by SOX17 and highlighted by a dashed line. Arrows show examples of SOX17+ cells that are PRDM14-negative at 12 h and PRDM14-positive on D1 of differentiation. Scale bar is 60 μm. b Quantification of results from a and Supplementary Fig. 2A, including the D1–D5 time points. Data show the percentage of PRDM14-Venus+SOX17+ cells as mean ± SD of n = 11 EB sections from two hPGCLC inductions. c Quantification of results from (Supplementary Fig. 2A) showing the percentage of PRDM14-Venus+SOX17+OCT4+ cells as mean ± SD of n = 3 EB sections from one hPGCLC induction.

