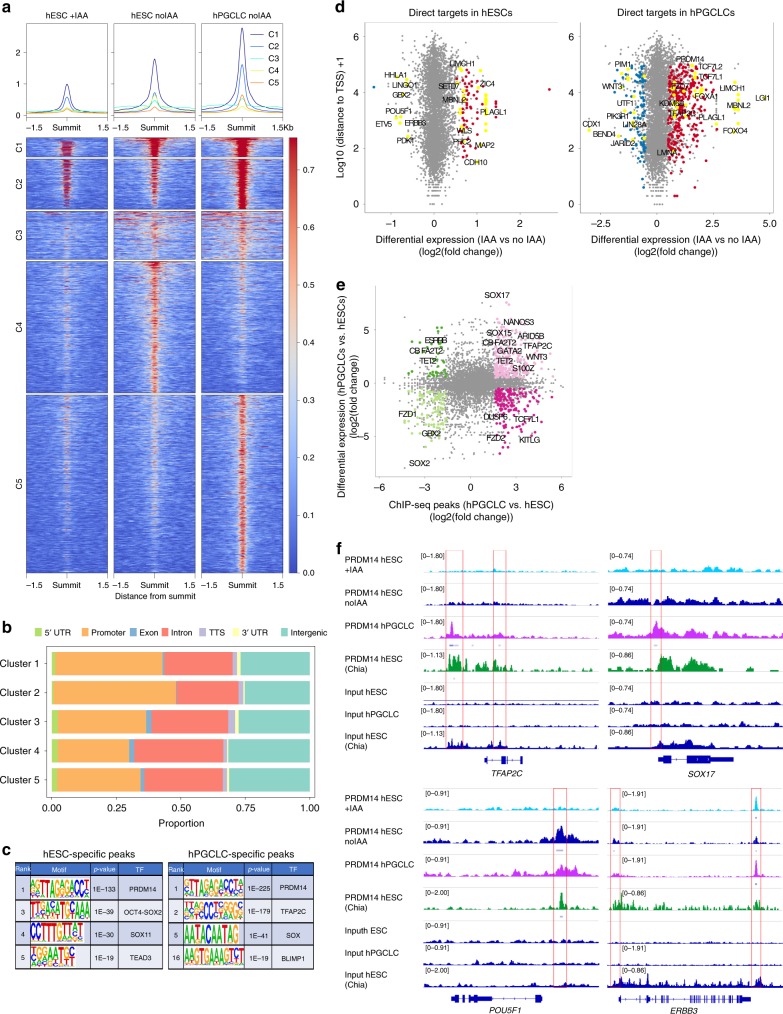
Fig. 7. ChIP-seq analysis shows hESC- and hPGCLC-specific PRDM14 binding patterns.
a Consensus PRDM14-bound peaks (6486) are separated into five clusters by k-means clustering. The ChIP signals (counts per million per 10-bp bin) of each peak are shown in the clustered heatmaps (bottom panel). The profile plots (top panel) show the average ChIP signals of each cluster. b Distribution of clustered PRDM14 peaks in the genome. Note that PRDM14 predominantly binds to promoters. c Top-ranking motifs identified by HOMER de novo motif analysis within hESC- and hPGCLC-specific PRDM14 peaks (FC > 3, p value < 0.0001). d Scatter plots highlighting examples of direct PRDM14 targets in hESCs and hPGCLCs. Direct targets were defined as genes with at least one PRDM14 ChIP-seq peak (q value < 0.05) within 100 kb of the TSS and showing significant changes in expression upon IAA treatment (log2FC < (−0.5) or >0.5 and padj < 0.05). e PRDM14 binds to regulatory regions of key hPGC-related genes. The scatter plot shows differential PRDM14 peaks (FC > 3, p value < 0.0001) correlated to genes differentially expressed between hESCs and hPGCLCs (log2FC < (−0.5) or >0.5 and padj < 0.05). f Examples of loci bound by PRDM14 in hPGCLCs and hESCs. Note that the peak downstream of ERBB3 is preserved in hESCs after IAA treatment. PRDM14 peaks in indicated samples were visualised using IGV software. PRDM14 ChIP-seq dataset from ref. 13 was added for comparison.

