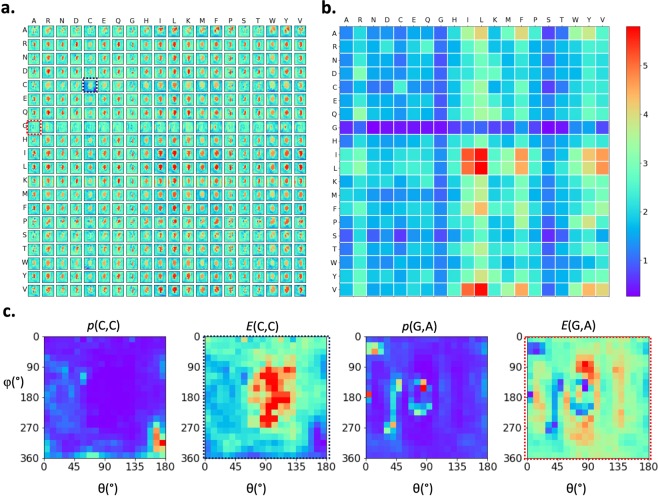
Figure 3.
Distributions of amino acid in the neighborhood of another amino acid. (a) Position-dependent energy functions of all 20 × 20 pairs of amino acids. Each row shows the neighborhoods centered at a specific amino acid type; and each entry in a row is the interaction energy between a neighboring amino acid and the centered amino acid. (b) Energy variances for each amino acid pair shown in (a). (c) Two representative amino acid neighboring preferences in the forms of probability distributions and energy functions, showing position preferences: cysteine in the neighborhood of cysteine (p(C,C) and E(C,C) shown on the left-hand side) and alanine in the neighborhood of glycine (p(G,A) and E(G,A) on the right). The corresponding energy functions are enclosed with dashed lines in (a).

