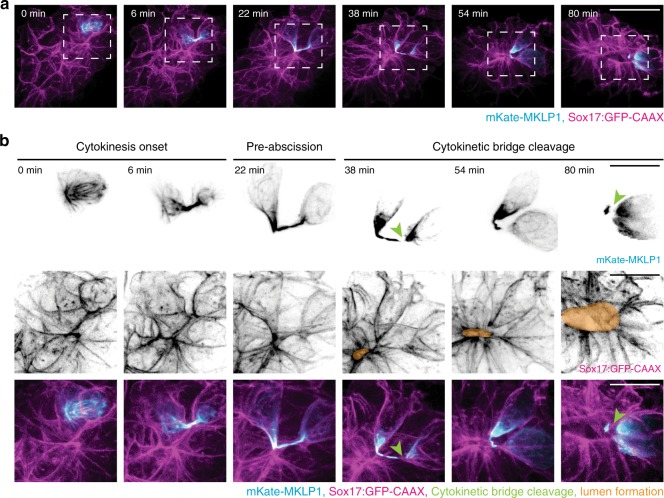
Fig. 3. Cytokinetic bridges are placed at the site of future KV lumen formation.
a A 3D rendering of a cell (mKate-MKLP1, cyan) dividing within KV (Sox17:GFP-CAAX, magenta) over time. Bar, 20 μm. b Cell within KV highlighted during cytokinesis onset (left), pre-abscission (center), and cytokinetic bridge cleavage (right). Region denoted with dashed line in a are shown in b. mKate-MKLP1 (top) and Sox17:GFP-CAAX (bottom) shown in grayscale and in merge below (mKate-MKLP1 in cyan, Sox17:GFP-CAAX in magenta). Green arrowhead denotes the locations of cytokinetic bridge cleavage; orange regions indicate lumen location. Bars, 10 μm.

