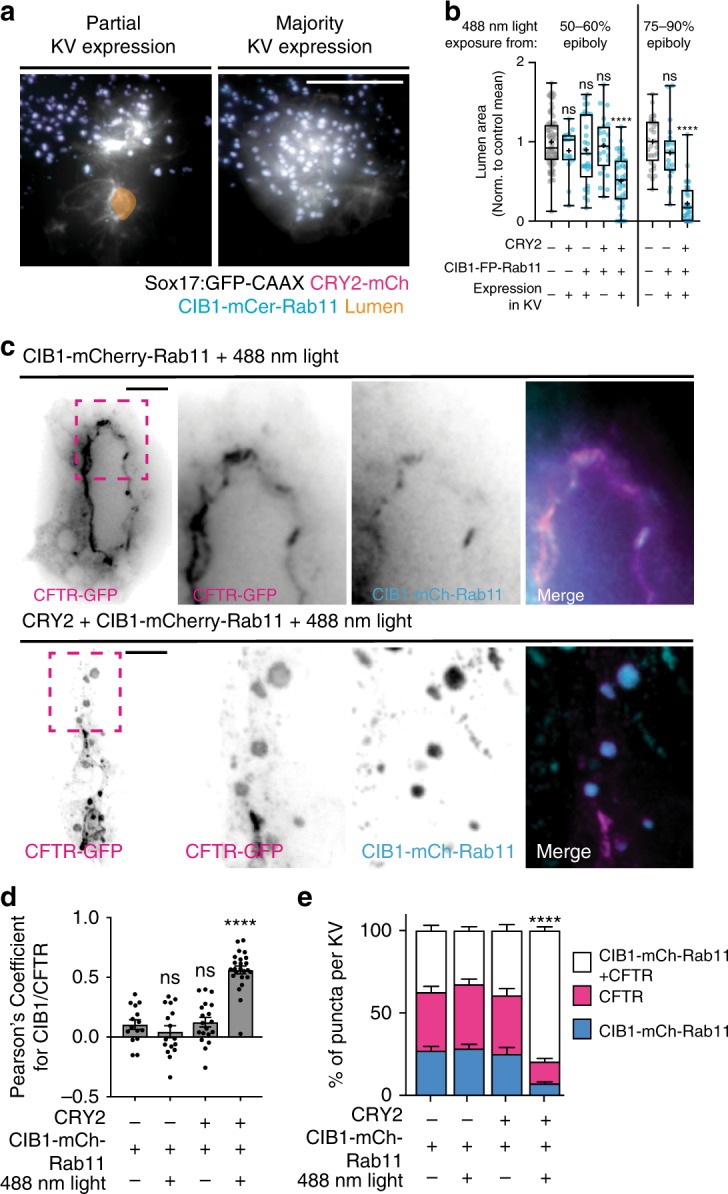
Fig. 6. Optogenetic clustering of Rab11 during KV development results in abnormal lumen formation and perturbed polarity establishment.

a Representative 3D renderings of KV under conditions of CRY2-mCherry/CIB1-mCerulean-Rab11 plus 488 nm light with partial (top) or majority KV mRNA expression (bottom). 3D rendering with lumen trace (orange), cell membrane (GFP-CAAX, white), CRY2-mCherry (magenta), and CIB1-mCerulean-Rab11 (cyan) shown. Bar, 50 μm. b Box and whisker plot depicting two-dimensional lumen area normalized to uninjected control values plus or minus 488 nm light beginning at 50–60% epiboly (left, n > 15 embryos) or 75–90% epiboly (right, n > 21 embryos). Dots represent individual KV values. Whiskers denote minimum and maximum values, 25th and 75th percentiles denoted by box boundaries. Median denoted by line within box and mean denoted by plus sign. One-way ANOVA with Dunnett’s multiple comparison test, compared with uninjected embryos. Statistical results detailed in Supplementary Table 5. c Representative 3D renderings of KV in CFTR-GFP (magenta) embryos under conditions of CIB1-mCherry-Rab11 (cyan, top) or CRY2 + CIB1-mCherry-Rab11 (cyan) + 488 nm light exposure (bottom). Dashed box represents insets shown at the right. Bars, 20 μm. d Bar graph depicting the Pearson’s coefficient for CFTR-GFP and CIB1-mCherry-Rab11 in embryos treated plus or minus 488 nm light exposure. ANOVA with Dunnett’s multiple comparison test, compared with embryos expressing CIB1-mCherry-Rab11 minus 488 nm exposure. Statistical results detailed in Supplementary Table 5. Mean displayed ± SEM. Dots represent individual values. e Bar graph depicting the percentage of puncta per KV expressing CFTR-GFP (magenta), CIB1-mCherry-Rab11 (cyan), or both (white). One-way ANOVA with Dunnett’s multiple comparison test completed for each cluster type, compared with percentages from embryos expressing CIB1-mCherry-Rab11 under normal light conditions. Statistical results detailed in Supplementary Table 5. d, e n > 10 embryos analyzed from five experiments. Mean displayed ± SEM. Dots represent individual values.
