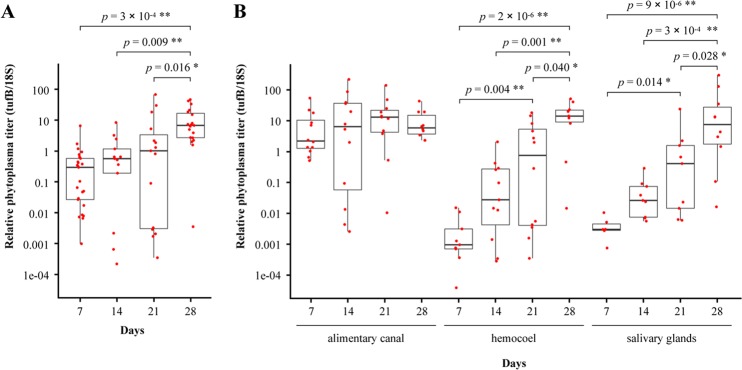
Figure 2.
Time course analysis of OY phytoplasma accumulation in M. striifrons by qPCR. Accumulations of OY phytoplasmas in the entire insect body (A) and in the alimentary canal, hemocoel, and salivary glands (B) were quantified at different days after acquisition start by qPCR. Only OY phytoplasma-positive samples were used to measure the relative phytoplasma titer. Each red point represents an OY-positive sample. Four dissected organs/tissues were pooled as one sample. Thick horizontal line in each boxplot represents the median of each dataset. Statistical significance was determined using Tukey’s honestly significant difference test. Only significant comparisons are shown. *p < 0.05, **p < 0.01.

