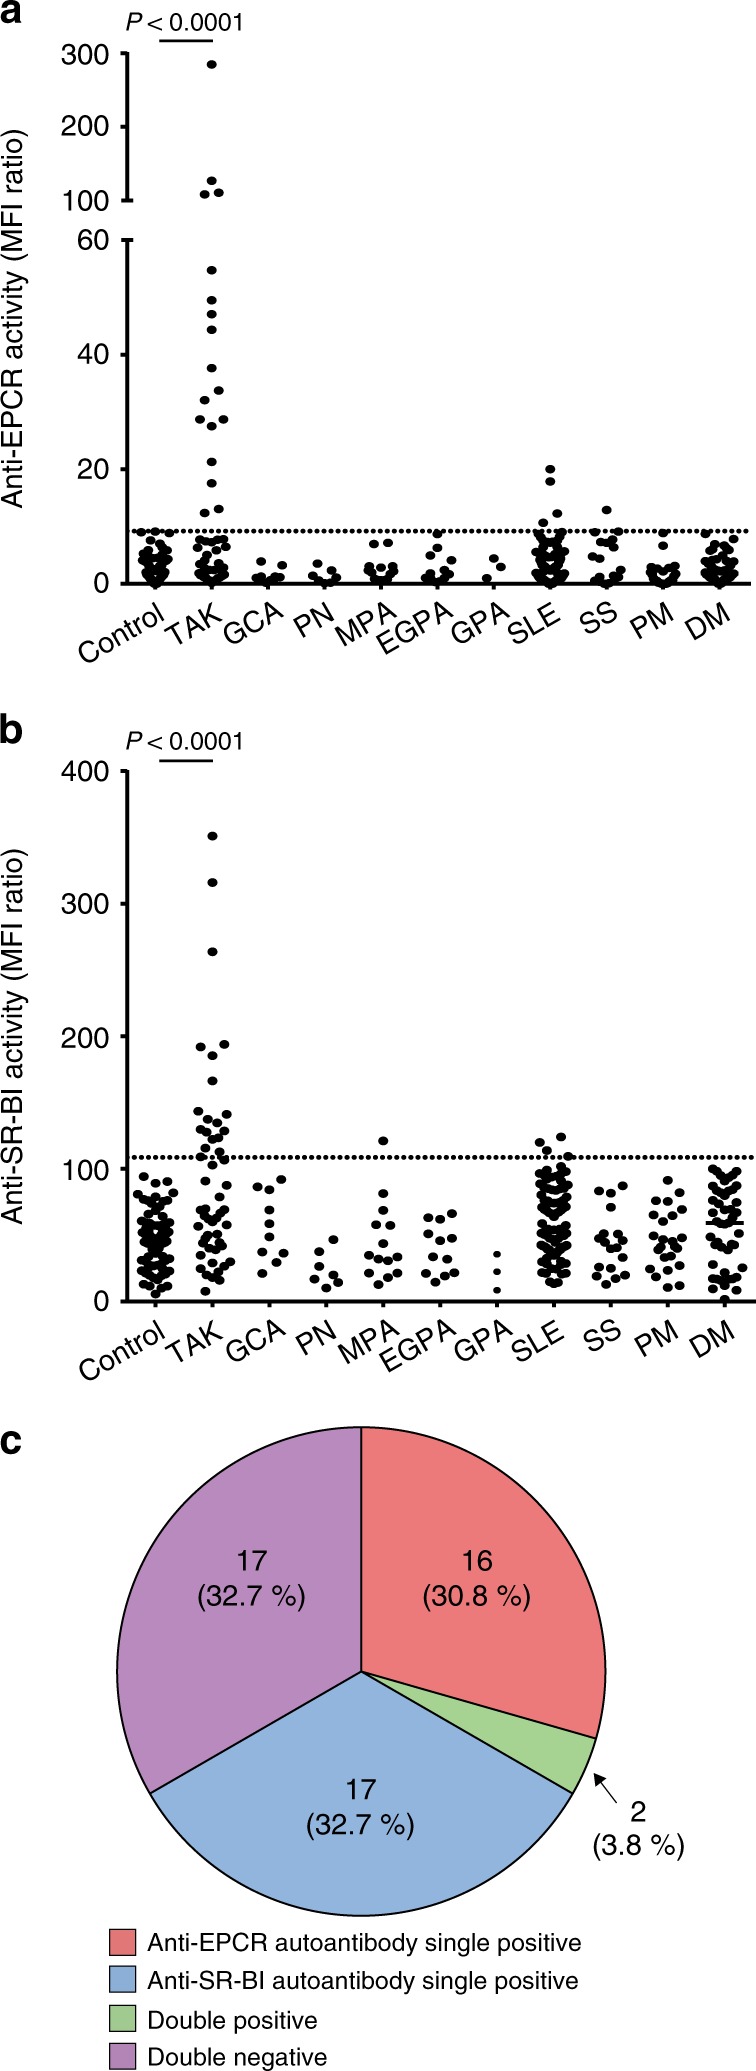
Fig. 4. Distribution of patients with anti-EPCR and anti-SR-BI activities.

a, b The distribution of anti-EPCR (a) and anti-SR-BI (b) autoantibodies in healthy controls and patients with various autoimmune rheumatic diseases was measured with flow cytometry. Dots represent the data for individual subjects. The broken horizontal line indicates the cut-off value for high activity (mean + 3 SD). Control represents 79 healthy individuals. Autoimmune rheumatic diseases include active Takayasu arteritis (TAK, n = 52), giant cell arteritis (GCA, n = 10), polyarteritis nodosa (PN, n = 7), microscopic polyangiitis (MPA, n = 14), eosinophilic granulomatosis with polyangiitis (EGPA, n = 12), granulomatosis with polyangiitis (GPA, n = 3), systemic lupus erythematosus (SLE, n = 93), Sjögren’s syndrome (SS, n = 18), polymyositis (PM, n = 24), and dermatomyositis (DM, n = 47). c The relative frequency of anti-EPCR and anti-SR-BI autoantibodies in patients with active TAK (n = 52) is shown. The numbers of patients and their proportions are indicated in the Figure. Statistical analysis was performed using one-way ANOVA test followed by Tukey’s post hoc test. MFI represents mean fluorescent intensity.
