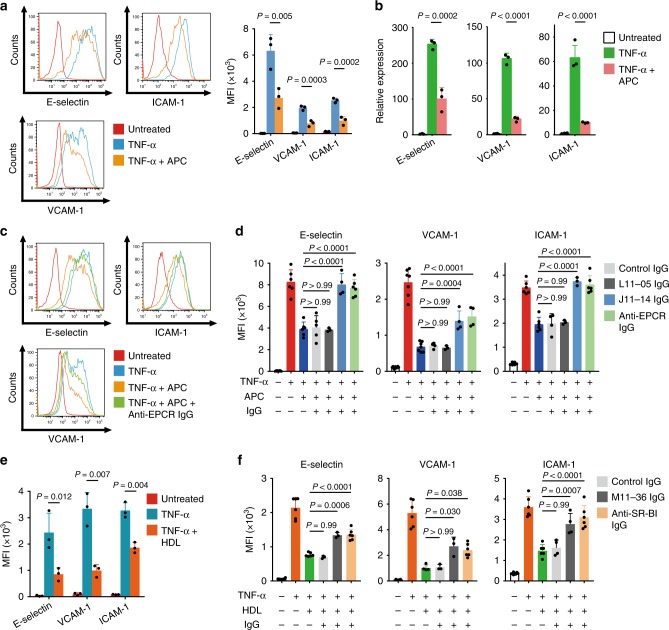
Fig. 5. Blocking of anti-inflammatory activities of EPCR and SR-BI by autoantibodies in Takayasu arteritis.
a, b HUVECs were treated with or without 10 µg/mL APC for 13 h and stimulated with 100 pg/mL TNF-α for 5 h. The expression of adhesion molecules, including E-selectin, VCAM-1, and ICAM-1, was analyzed with flow cytometry. Representative histograms (left) and the summary graph (right, n = 3) are shown in a. The mRNA expression level was measured by quantitative PCR in b. GAPDH was used as the internal control. c HUVECs were incubated with the isotype or 10 µg/mL anti-EPCR antibody for 1 h and treated with or without 10 µg/mL APC for 13 h. Then, cells were stimulated with 100 pg/mL TNF-α for 5 h. The expression of adhesion molecules was analyzed with flow cytometry. d HUVECs were incubated with or without IgG for 1 h. IgG included 10 µg/mL anti-EPCR antibody, 2.56 mg/mL control IgG, 2.56 mg/mL IgG from an AECA-negative TAK sample (L11-05), or 2.56 mg/mL IgG from anti-EPCR-positive TAK AECA sample (J11-14). The cells were subsequently treated as described above, and the expression of adhesion molecules was analyzed. e HUVECs were treated with or without 1 mg/mL high-density lipoprotein (HDL) for 16 h and stimulated with 100 pg/mL TNF-α for 5 h. Adhesion molecules were analyzed by flow cytometry; the summary graph is shown (n = 5). f HUVECs were incubated with or without IgG for 1 h. IgG included 10 µg/mL anti-SR-BI antibody, 2.56 mg/mL control IgG, or 2.56 mg/mL IgG from anti-SR-BI positive TAK AECAs (M11-36). Cells were subsequently treated with or without 1 mg/mL of HDL as described above, and adhesion molecules were analyzed (n = 3). Data are indicated as mean ± SD. At least three independent experiments were performed in all cases. Statistical analysis was performed using one-way ANOVA followed by Tukey’s post hoc test. MFI represents mean fluorescent intensity. L11-05, J11-14, and M11-36 indicate the serum sample number.

