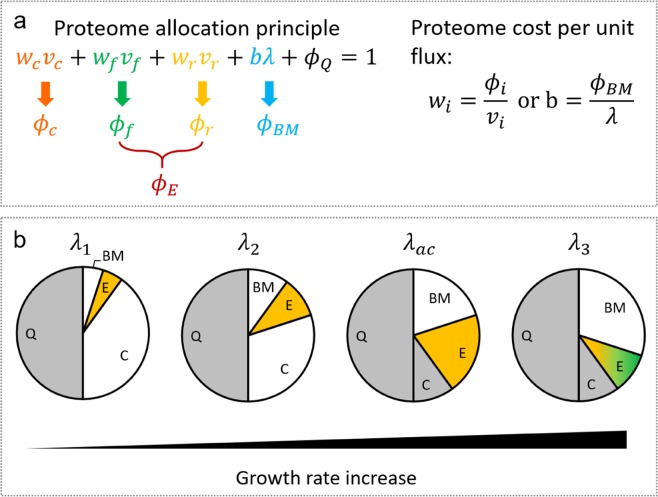
Figure 1.
Schematic diagram of the proteome allocation model. (a) The overall proteome comprises four sectors, including carbon-scavenging , energy biogenesis , biomass synthesis and growth-independent offset . The enzymatic cost per unit flux of each sector is calculated by the ratio between proteome abundance and the corresponding flux. (b) The evolution of proteome component at increased growth rate. Before acetate overflow, BM and E sectors increase with growth rate while the C sector continuously declines; The E sector comprises only respiration (marked in yellow). At , reaches the highest value. At higher growth rates, the E sector starts to decline to save space for the increase of the BM sector and becomes a mixture of fermentation and respiration (marked with a mixture of yellow and green); the C sector reaches its lower bound and stays constant.

