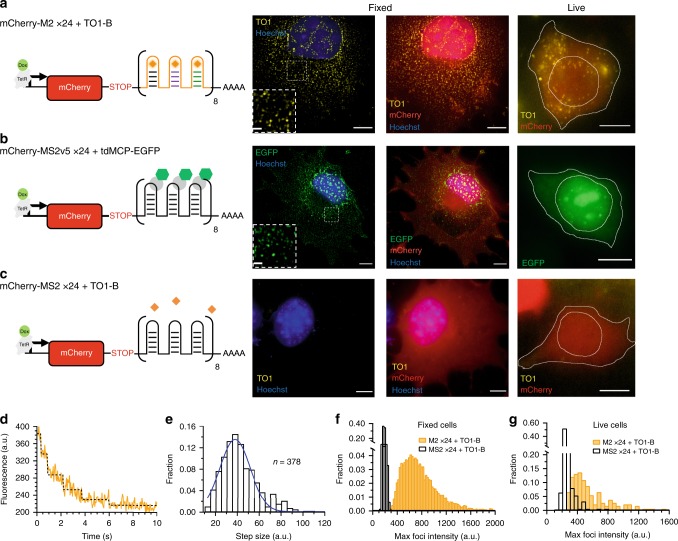
Fig. 2. Cellular imaging of Mango II arrays.
a Diagram of the mCherry-M2x24 construct + TO1-Biotin controlled by a doxycycline inducible promoter. Followed by representative fixed maximum projections (left & centre) and live cell images of observed cellular foci (right). b Diagram of the mCherry-MS2v5x24 construct + tdMCP-EGFP under the control of a doxycycline inducible promoter. Followed by representative fixed maximum projections (left & centre) and live cell images of observed cellular foci (right). c Diagram of the mCherry-MS2v5x24 construct + TO1-Biotin under the control of a doxycycline inducible promoter. Followed by representative fixed maximum projections (left & centre) and live cell images of observed cellular foci (right). For (a–c) TO1-Biotin signal is in yellow, EGFP signal is in green, mCherry is in red, Hoechst 33258 is in blue and scale bars = 10 µm and 1 µm inset. Fixed cell images depict expression in Cos-7 cells and live cell images depict expression in HEK 293 T cells. d Representative bleaching curve for an individual foci from a fixed Cos-7 cell, (yellow) fitted with a maximum likelihood step finding algorithm57 (black). e Distribution of 378 calculated bleaching step sizes from 70 individual mCherry-M2x24 foci from eight fixed cells. f Fixed cell maximum foci intensity distributions of mCherry-MS2v5x24 (black) and mCherry-M2x24 (yellow) in the presence of 200 nM TO1-Biotin. The M2x24 distribution quantifies~7000 foci from 13 cells. g Maximum live-cell foci intensities for cells expressing mCherry-M2x24 (yellow) and mCherry-MS2v5x24 (black) in the presence of 200 nM TO1-Biotin. n = 183 and 187 foci, respectively.

