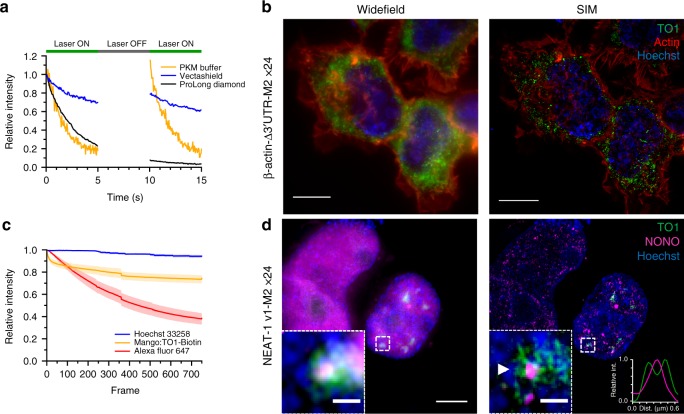
Fig. 5. Super resolved imaging of Mango tagged RNAs.
a Bleaching curves of individual mCherry-M2x24 foci in fixed HEK293T cells using different media (PKM buffer—yellow, Vectashield® - blue and Prolong® Diamond – black) upon 5 s intervals of constant illumination. b Widefield and SIM maximum projections of the β-actin-∆3′UTR-M2x24 construct (green) costained with Phalloidin-AF647 (red) and Hoechst 33258 (blue), scale bar = 10 µm. HEK293T cells. c Mean intensity bleaching curves of Hoechst, Mango and Phalloidin signal during structured illumination acquisition of β-actin-∆3’UTR-M2x24 expressing HEK293T cells. The standard deviation is plotted as the shaded area around each curve obtained from eight different fields of view. d Widefield and SIM maximum projections of NEAT-1 v1-M2x24 construct (green) costained NONO (magenta) and Hoechst 33258 (blue) in HEK293T cells. Zoom of highlighted foci shown as inset. Large scale bars = 5 µm, inset scale bars = 0.5 µm. Inset intensity profile (lower right) of annotated NONO foci (magenta) from SIM maximum projection showing the peripheral NEAT-1 signal (green).

