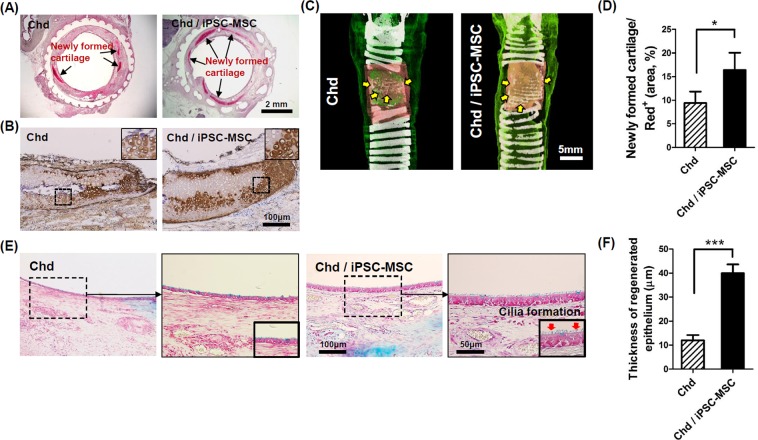
Figure 7.
Tracheal reconstruction through co-transplantation of primary chondrocytes and iPSC-MSCs. (A) Newly formed cartilage (arrow, red color) is observed as assessed by safranin O staining. (B) Type II collagen-specific immune-dab staining shows a brown positive signal with a lacunae structure. (C) The defect site was also analyzed at week 4 for cartilage regeneration via reconstruction of micro-CT images. Yellow arrows indicate regenerative cartilage in the region of the tracheal scaffold implant. (D) Regenerative tracheal cartilage was calculated based on the quantity of white signal within the area of the region of interest (red+) in micro-CT images. (*P < 0.05). (E) Alcian blue staining shows re-epithelialization on the luminal surface in segmental tracheal defects. In particular, the Chd/iPSC-MSC group exhibited thick epithelial regeneration and cilia formation. (F) Quantitative analysis of the thickness of regenerative epithelium 4 weeks after surgery. The epithelial thicknesses were significantly increased in the Chd / iPSC-MSC groups than in the Chd groups (***P < 0.001).

