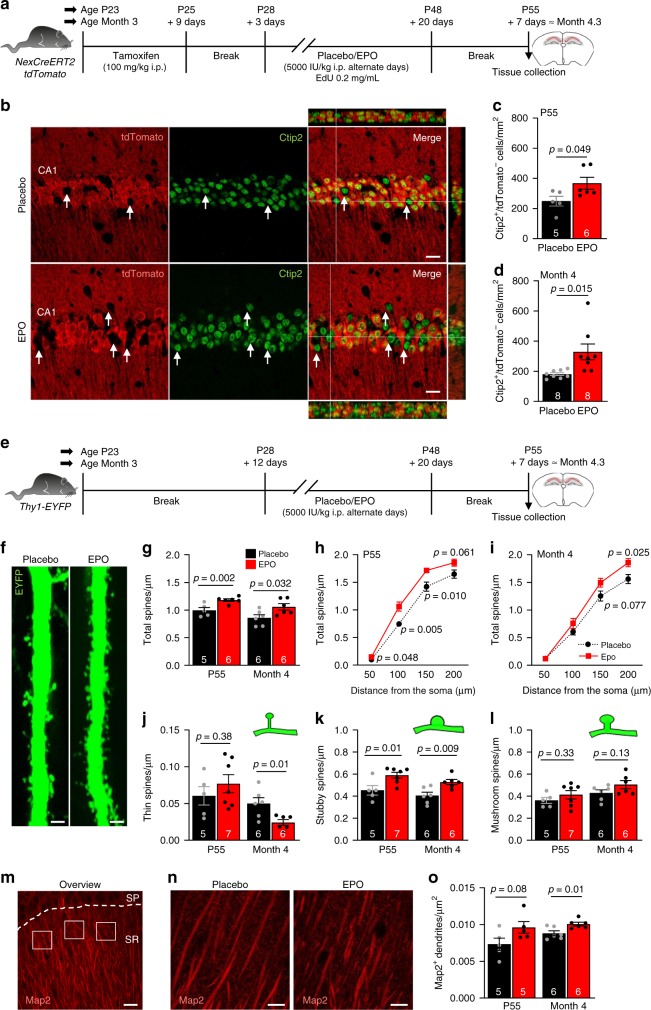
Fig. 1. EPO increases number of pyramidal neurons and spine density in the CA1 region of the hippocampus.
a Experimental design to determine the effect of EPO on neuron numbers: two cohorts of NexCreERT2::tdTomato mice (starting at age P23 or month 3) were administered tamoxifen (at P23: 5× i.p.; at month 3: 10× i.p.), followed by placebo or EPO (5000IU/kg; 11× i.p.) on alternate days for 3 weeks. b Representative images of tdTomato (red) and Ctip2 (green; excitatory neuronal marker) staining in CA1 of placebo or EPO-treated mice. White arrows indicate newly generated neurons. c, d Quantification of newly generated neurons (Ctip2+/tdTomato−) in CA1 of P55 c and ~4-month-old mice d treated with placebo or EPO. Data from n = 5/8 (placebo; 1c/d) and n = 6/8 (EPO; 1c/d) mice. e Experimental design to determine the effect of EPO on dendritic spine number and morphology: Thy1-EYFP mice (starting at age P28 or month 3) were treated with placebo or EPO (11× i.p.) on alternate days, for 3 weeks. f Representative images of EYFP (green) expression in principal apical dendrites in CA1 of placebo or EPO mice. g–i For P55 and ~4-month-old mice, total number of spines (per µm) are given as bar graphs g and, additionally, as line graphs h–i presenting their distance from the soma. Data from n = 5/6 (placebo; P55/4 months) and n = 6 (EPO) mice (6 cells/mouse analyzed). j–l Based on the morphology (illustrated as green insets), the number of thin j, stubby k, and mushroom l spines (per µm) were sub-quantified. m Representative image of the quantification method employed for determining the number of dendrites using dendritic marker Map2 (red) in CA1 stratum radiatum (SR); stratum pyramidale (SP). White boxes denote areas of measurements. n Representative images of Map2 (red) staining in ~4-month-old mice treated with placebo or EPO. o Quantification of Map2+ dendrites in P55 and 4-month-old mice treated with placebo or EPO. Data from n = 5/6 (placebo; P55/4 months) and n = 5/6 (EPO; P55/4 months) mice. Within bars, mouse n numbers indicated; mean ± SEM presented; two-tailed Student’s t-test; scale bars: b 50 µm; f 10 µm; m 20 µm; and n 10 µm. Source data underlying graphs c, d, g–l, and o are provided as a Source Data File.

