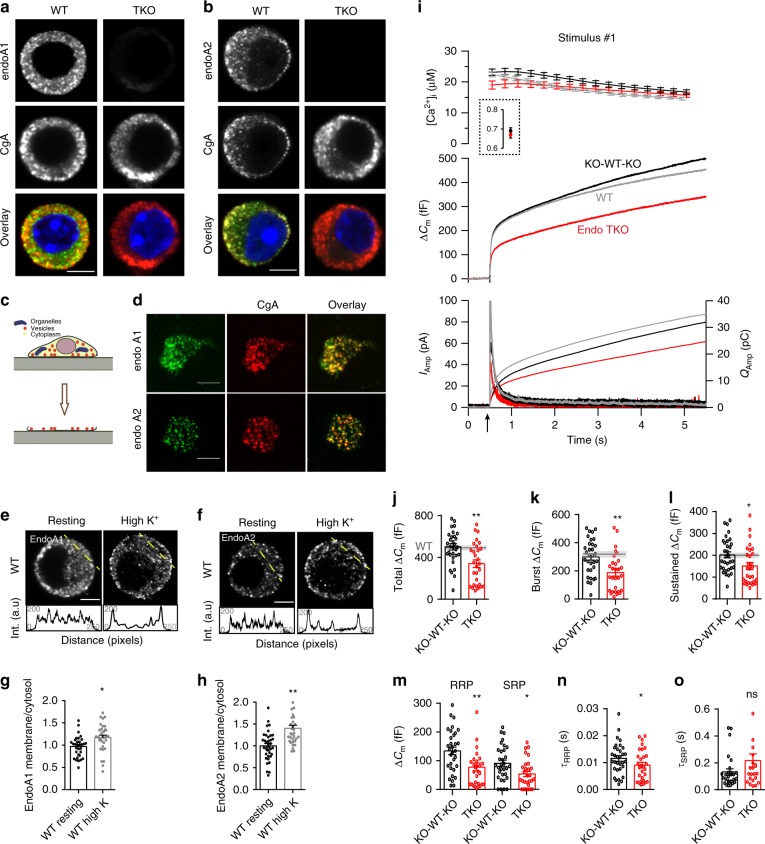
Fig. 1. Endophilins are enriched at neurosecretory vesicles and required for efficient chromaffin cell exocytosis.
a, b Representative confocal images of WT and endophilin TKO mouse chromaffin cells stained for endophilin-1 (a) or endophilin-2 (b), and co-labeled with chromogranin-A (CgA), a LDCV marker. Scale bar 3 µm. For colocalization quantification, see Suppl. Fig 1c, d. c Plasma membrane sheet generation from cultured cells. d Representative plasma membrane sheets from chromaffin cells stained for endophilin-1 (top) or endophilin-2 (bottom) along with CgA. Scale bar 2 µm. Colocalization coefficient: 0.28 ± 0.13 endophilin-1 (N = 3 exp.; n = 26 sheets), 0.30 ± 0.11 endophilin-2 (N = 3 exp.; n = 20 sheets). e–h Upon stimulation, higher levels of endophilin-1 (e) and endophilin-2 (f) were present at the plasma membrane, as shown by intensity profiles along the lines indicated on the cells. Scale bar 3 µm. g, h Quantifications of endophilin redistribution. Endophilin-1: N = 3 exps; n = 32 (WT), 33 (TKO) cells, p = 0.005; Endophilin-2: N = 3 exps, n = 38 (WT) and 33 (TKO) cells, p < 0.0001, unpaired two-tailed t-test. (i) Exocytosis (indicated by the arrow) was reduced in endophilin TKO cells (red traces; N = 4 exps, 6 mice (29 cells)) compared to endophilin KOWTKO littermate cells (black traces; N = 4 exps, 6 mice (32 cells) and to (non-littermate) WT C57BL6/J cells (gray traces; N = 4 exps, 6 mice (60 cells)). i Top: intracellular calcium levels: The inset shows pre-stimulation calcium levels. Middle: averaged membrane capacitance changes upon Ca2+-induced exocytosis. Bottom: mean amperometric current (left axis) and cumulative charge (right axis). j–l Analysis of capacitance (KOWTKO: N = 4 exps, 6 mice (32) and TKO: N = 4 exps, 6 mice (29)) revealed an overall reduction of exocytosis. Gray line: the mean of 39 WT cells (non-littermate controls), shaded area: SEM. Note changes in burst (exocytosis within 1 s; k) and sustained phase of release (l). m Both RRP and SRP were reduced in TKO cells. n Fusion kinetics of RRP vesicles was faster in TKO cells. o Although on average slower, the SRP fusion kinetics constant was not significantly changed in TKO cells (m–o, N = 4, KOWTKO 6 mice (30) and TKO 6 mice (29)). Unpaired two-sided t-test, *p < 0.05, **p < 0.01, ns not significant. Error bars denote SEM.

