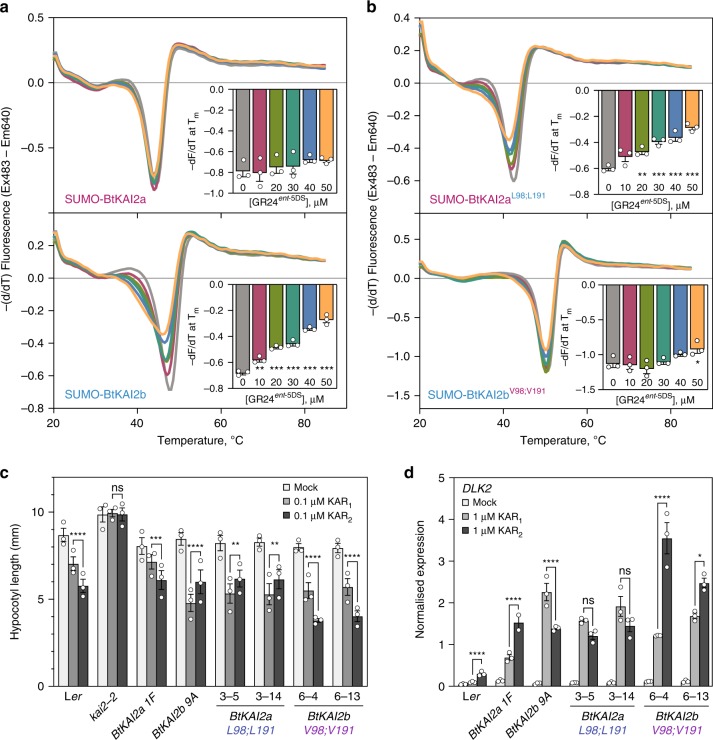
Fig. 4. Two residues account for ligand specificity between BtKAI2a and BtKAI2b.
a DSF curves of SUMO-BtKAI2a and SUMO-BtKAI2b fusion proteins treated with 0–50 µM GR24ent-5DS, a KAI2-bioactive ligand. Each curve is the average of three sets of reactions, each comprising four technical replicates. Insets plot the minimum value of −(dF/dT) at the melting point of the protein as determined in the absence of ligand (means ± SE, n = 3). Significant differences from untreated control: *P < 0.05, **P < 0.01, ***P < 0.001 (ANOVA). b DSF curves of SUMO-BtKAI2aL98;L191 and SUMO-BtKAI2bV98;V191 fusion proteins treated with 0–50 µM GR24ent-5DS. c Hypocotyl elongation responses of Arabidopsis expressing GFP-BtKAI2aL98;L191 and GFP-BtKAI2bV98;V191 fusion proteins and treated with KAR1 or KAR2. Data are a summary of three experimental replicates performed on separate occasions, each comprising 25–40 seedlings per genotype/treatment combination. Data for each replicate are shown in Supplementary Fig. 11. Error bars are SE, n = 3 experimental replicates; each dot corresponds to the mean value derived from each replicate. Asterisks denote significant differences: *P < 0.05, **P < 0.01, ***P < 0.001, ****P < 0.0001 (linear mixed model with experimental replicate as a random effect; specific pairwise comparisons using Tukey’s HSD correction). d Levels of DLK2 transcripts in 8-day-old seedlings of the same transgenic lines as above treated with 1 µM KAR1, 1 µM KAR2, or 0.1% acetone (mock) and harvested 8 h later. Expression was normalised to CACS reference transcripts. Data are means ± SE of n = 3 pools of ~50 seedlings treated in parallel. Asterisks denote significant differences as above (two-way ANOVA; specific pairwise comparisons using Tukey’s HSD correction). Source data are provided as a Source Data file.

