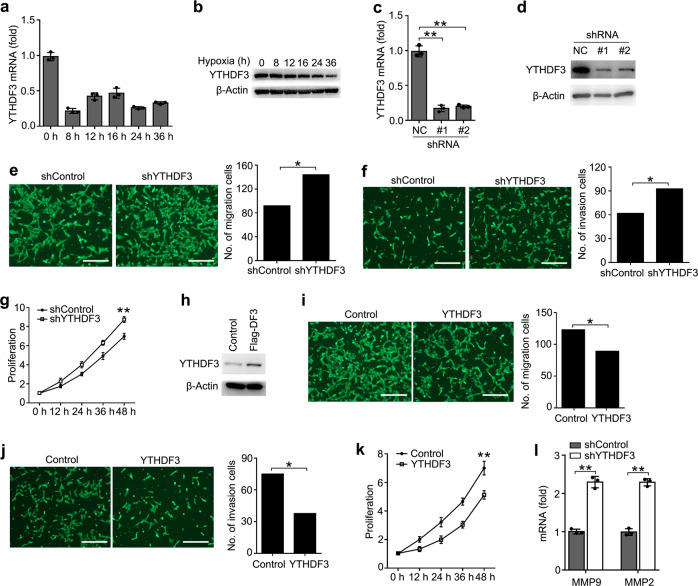
Fig. 2. YTHDF3 inhibited the activity of trophoblast.
a, b qRT-PCR and immunoblot analysis of YTHDF3 mRNA (a) and protein (b) in trophoblast treated with hypoxia as indicated time. The gene expression was normalized to that of the β-actin internal control in each sample. c, d qRT-PCR and immunoblot analysis of YTHDF3 in trophoblast HTR8/SVneo transfected with lentiviral shControl (NC), YTHDF3 shRNA #1 or #2 as indicated for 72 h. e, f Left: Migration (e) and invasion (f) analysis of HTR8/SVneo cells stably expressing control shRNA (shControl) vs. shRNA targeting YTHDF3 (shYTHDF3) by Transwell assay. Representative images are shown. Right: The number of migration and invasion cells was counted by the ImageJ software. g, k Cell proliferation measured by CCK8 assay of HTR8/SVneo cells stably expressing shYTHDF3 (g) and YTHDF3 (k) as indicated. The value of OD450 was normalized to the value about 24 h after cell seeding. h Immunoblot analysis of HTR8/SVneo cells stably expressing YTHDF3 as indicated. i, j Left: Migration (i) and invasion (j) analysis of HTR8/SVneo cells transfected with YTHDF3 plasmid by Transwell assay. Representative images are shown. Right: The number of migration and invasion cells was counted by the ImageJ software. l qRT-PCR analysis of MMP9 and MMP2 mRNA in HTR8/SVneo stably expressing shControl and shYTHDF3 as indicated. Scale bars, 100 μm; *p < 0.05, **p < 0.01 (Student’s t test). Data are representative of three independent experiments (mean and s.d. of technical triplicates (a, c, g, k, l)).

