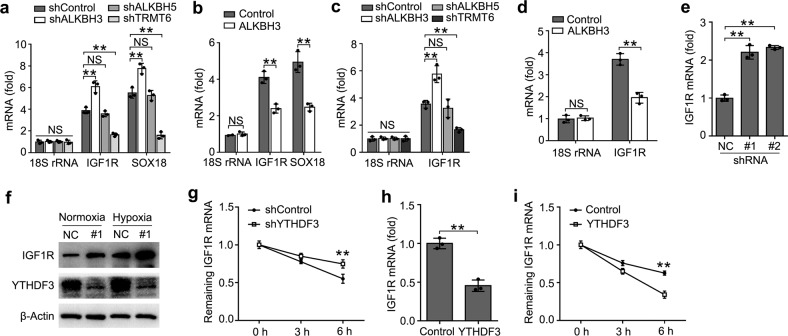
Fig. 5. YTHDF3 inhibited IGF1R expression.
a, b Enrichment fold of the indicated RNA transcripts in m1A IP vs. RNA input control in HTR8/SVneo after transfected with the indicated shRNA for 72 h (a) or plasmids (b) for 48 h. Each transcript was quantified by qRT-PCR. c, d Enrichment fold of the indicated RNA transcripts in YTHDF3 IP vs. RNA input control in HTR8/SVneo after transfected with the indicated shRNA for 72 h (a) or plasmids (b) for 48 h. e, f qRT-PCR and immunoblot analysis of the indicated mRNA and protein in HTR8/SVneo transfected with shYTHDF3 for 72 h. g, i RNA lifetime for IGF1R in HTR8/SVneo cells transfected with the shYTHDF3 (g) or YTHDF3 plasmids (i) was determined by monitoring transcript abundance after transcription inhibition (TI). h qRT-PCR analysis of the IGF1R in HTR8/SVneo transfected with plasmids as indicated for 48 h. NS: not significant; **p < 0.01 (Student’s t test); NS, not significant. Data are representative of three independent experiments (mean and s.d. of technical triplicates (a–d, e, g–h)).

