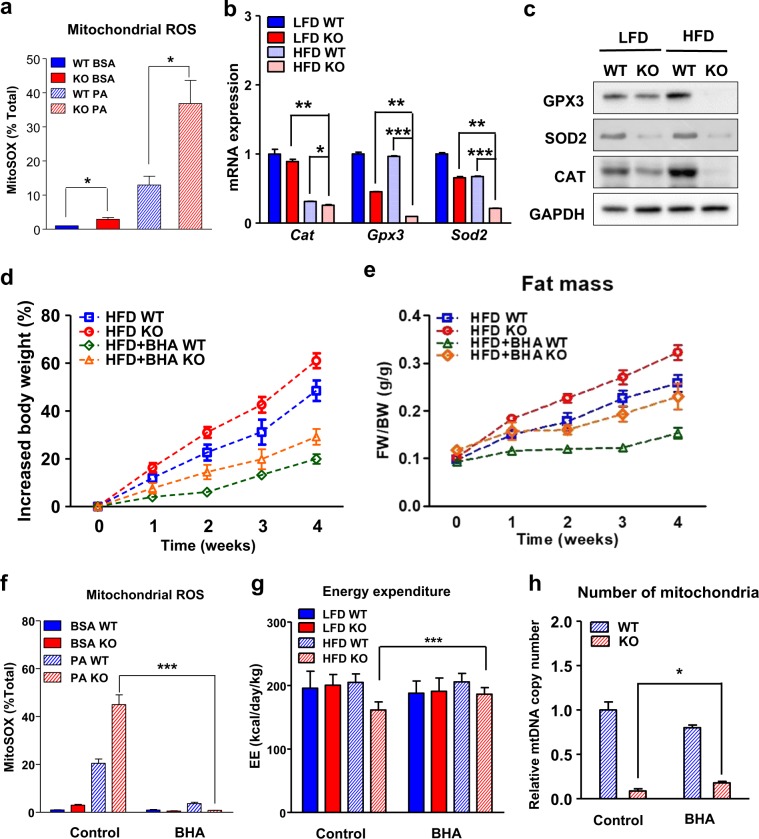
Fig. 5. The effects of HFD on ROS production in the iBAT from the WT and IDH2KO mice, and the protective effect of an antioxidant against diet-induced obesity.
a Primary brown adipocytes were cultured from the WT and IDH2KO mice (n = 3 per group) and treated with BSA or BSA plus palmitate, and the stained area was quantified with MitoSOX Red followed by FACS analysis. This experiment was repeated three times. b, c The mRNA and protein levels of key antioxidant genes/proteins in the iBAT from the WT and IDH2KO mice. d, e Growth curves and fat mass for control or butylated hydroxyanisole (BHA)-treated mice fed a LFD or HFD (n = 6 per group). f Primary brown adipocytes cultured from the WT and IDH2KO mice and treated with BSA or BSA plus palmitate, and the percentage of MitoSOX-positive cells stained with MitoSOX Red followed by FACS analysis (n = 3 per group). g Energy expenditure over a 24-h period of the WT and IDH2KO mice in the control or BHA-treated LFD and HFD groups. h Relative mitochondrial DNA content expressed as a function of total genomic DNA (mtDNA) in the iBAT from the control or BHA-treated HFD–IDH2KO mice. *p < 0.05, **p < 0.01, and ***p < 0.001 vs. the LFD–IDH2KO mice or HFD–WT mice.

