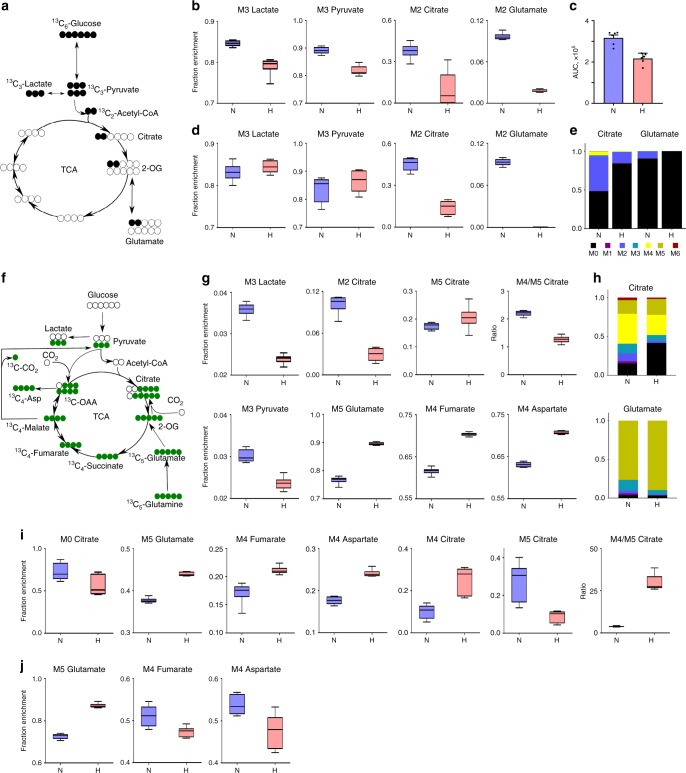
Fig. 1. [13C6]Glucose and [13C5]glutamine labeling of MIO-M1 and primary Müller cells.
[13C6]Glucose and [13C5]glutamine labeling of MIO-M1 and primary Müller cells demonstrates hyperoxia-induced decreased flux from pyruvate to citrate and glucose to glutamate, but increased glutaminolytic flux into TCAC via oxidative decarboxylation, and decreased malic enzyme flux. MIO-M1 cells were cultivated in [13C6]glucose media for 24 h to reach isotopic steady state, then incubated in normoxia (21% O2) or hyperoxia (75% O2) for 8 or 24 h. a Schema of first round labeling of [13C6]glucose carbon through glycolysis and TCAC. b Fractional enrichment of 13C-labeled metabolites after 8 h hyperoxic treatment (n = 6, t-test p values: M3 lactate = 0.0001; M3 pyruvate < 0.0001; M2 citrate = 0.0006; M2 glutamate p < 0.0001). c Total (sum all MIDs) glutamate in normoxic vs. hyperoxic cells, after 8 h hyperoxic treatment (n = 6, t-test, mean ± SEM, p values = 0.0002). d Fractional enrichment of 13C-labeled metabolites after 24 h of hyperoxic treatment (n = 6, t-test p values: M3 lactate = 0.2365; M3 pyruvate = 0.2862, M2 citrate < 0.0001, M5 glutamate < 0.0001). e Mass isotopomer distributions of citrate and glutamate between normoxia and hyperoxia. Mass isotopomer distributions were corrected for natural isotope abundances for data represented in this figure and subsequent figures. f Schema of [13C5]glutamine carbon atoms transition through TCAC, malic enzyme, pyruvate carboxylase, and glycolytic pyruvate entry into TCAC. MIO-M1 or primary Müller cells were cultured in [13C5]glutamine media for 24 h, then incubated further in normoxia (21% O2) or hyperoxia (75% O2) for 24 h. g Fractional enrichment of 13C-labeled metabolites after 24 h hyperoxic treatment (n = 6, t-test p values: M3 lactate < 0.0001; M2 citrate < 0.0001; M5 citrate < 0.1198; M4/M5 citrate < 0.0001; M3 pyruvate < 0.0001; M5 glutamate < 0.0001; M4 fumarate < 0.0001; M4 aspartate < 0.0001). h Comparison of mass isotopomer distributions of citrate and glutamate between normoxia and hyperoxia. i Fractional enrichment of 13C-labeled metabolites in primary Müller cells after 24 h hyperoxic treatment (n = 6 per condition; t-test p values: M0 citrate < 0.027; M5 glutamate < 0.0001; M4 fumarate < 0.0007; M4 aspartate < 0.0001; M4 citrate = 0.0005; M5 citrate = 0.0016; M4/M5 citrate < 0.0001). j Fractional enrichment of 13C-labeled metabolites in primary astrocytes after 24 h hyperoxia. N normoxia, H hyperoxia, AUC area under curve. Box plots extend from 25 to 75th percentiles. Middle box line = median; whiskers represent minimal/maximal values for Fig. 1 and all subsequent box plots in Figs. 2 and 3. p values = two-sided unpaired t-test.

