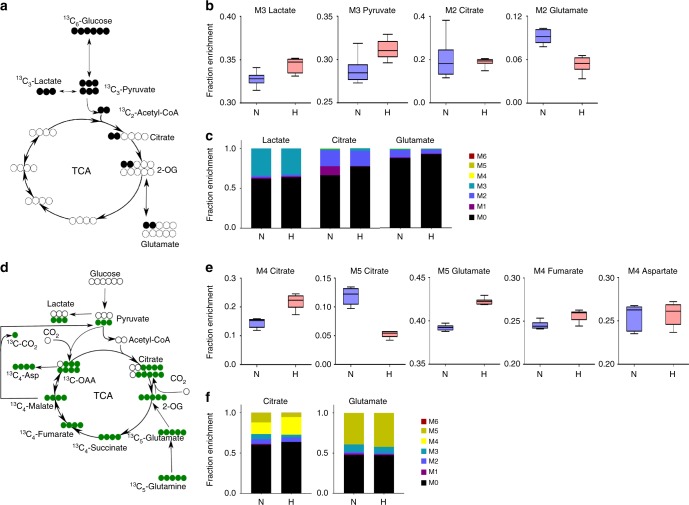
Fig. 2. [13C6]Glucose and [13C5]glutamine labeling of retinal endothelial cells in culture.
In response to hyperoxia, [13C6]Glucose and [13C5]glutamine labeling of retinal endothelial cells in culture demonstrates no change in pyruvate to citrate flux, (a net decrease in glutamate production from glycolytic carbon, increased glutaminolytic flux feeding into TCAC via oxidative decarboxylation route, and decreased malic enzyme flux. Retinal endothelial cells were cultivated in [13C6]glucose containing media for 24 h to reach isotopic steady state, following which they were either incubated further in normoxia (21% O2) or hyperoxia (75% O2) for 24 h. a Schematic of the first round of [13C6]glucose carbon atom transition through glycolysis and TCAC. b Fractional enrichment of 13C-labeled metabolites after 24 h of hyperoxic treatment (n = 6, t-test p values: M3 lactate = 0.0086; M3 pyruvate = 0.0138; M2 citrate = 0.7974; M2 glutamate < 0.0001). c Comparison of mass isotopomer distributions of lactate, citrate and glutamate between normoxia and hyperoxia. d REC cells were cultivated in [13C5]glutamine containing media for 24 h to reach isotopic steady state, following which they were either incubated further in normoxia (21% O2) or hyperoxia (75% O2) for 24 h. e Fractional enrichment of 13C-labeled metabolites after 24 h of hyperoxic treatment (n = 6, t-test p values: M4 citrate = 0.0002; M5 citrate < 0.0001; M5 glutamate < 0.0001; M4 fumarate = 0.0070; M4 aspartate = 0.7713). f Comparison of mass isotopomer distributions of citrate and glutamate between normoxia and hyperoxia. N normoxia, H hyperoxia.

