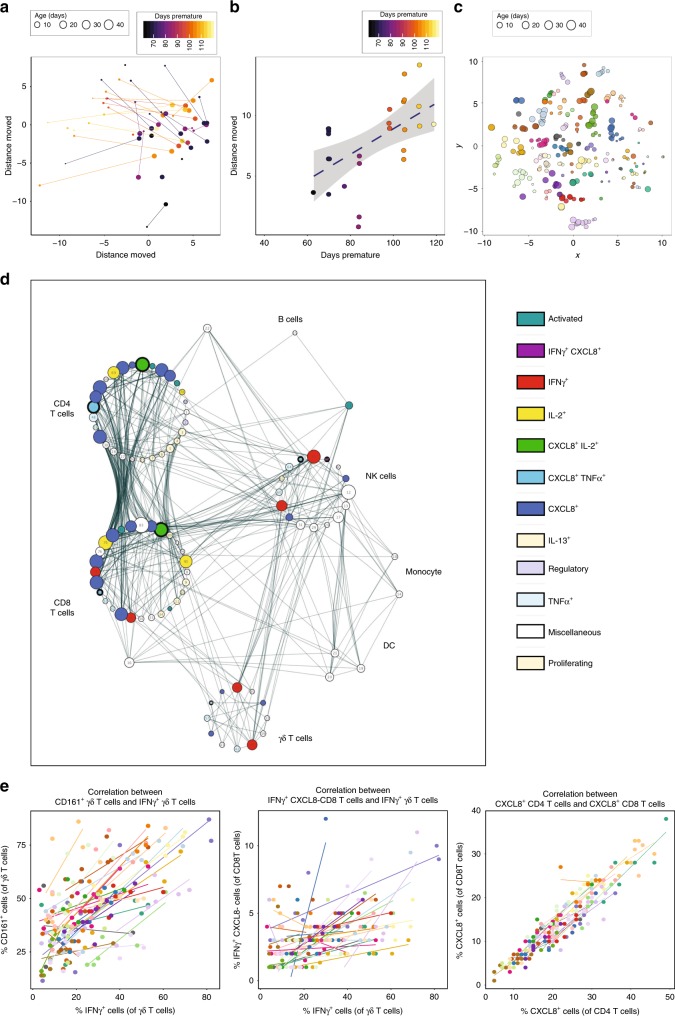
Fig. 3. Development of whole immune profiles and correlations.
Longitudinal PBMC samples were phenotyped by flow cytometry as described. a, b Analyses of the immune parameters from 39 preterm babies shows that the immune profile of extremely preterm babies (lighter colour) travels a longer distance, but on the same trajectory compared to their less preterm counterparts (darker colour) as depicted by: a PCA of the immune profile of samples taken in the first week (small circle, mean = 3.8 days) compared to that of the sample taken 5 weeks later (large circle, mean = 37 days) for each baby. The colour gradient represents how many days preterm the baby was at birth (counting down from 40 weeks). Each circle represents a sample from an individual baby and the size represents postnatal age of the baby at sampling. Lines link individual babies. b Scatter plot quantifying the Euclidian distance moved in PC1 and PC2 for each baby. The colour gradient represents how many days preterm the baby was at birth. Each symbol represents an individual baby. c t-Distributed stochastic neighbour embedding (tSNE) analysis of the immune parameters shows that babies have their own individual profile. Each circle represents a sample from an individual baby (the size of the circle depicts the postnatal age of the baby when the sample was taken) and each colour represents longitudinal samples from the same baby. d Network represents statistically significant (p < 0.008) Spearman’s correlation coefficients (R ≥ 0.3 or R ≤ −0.3) between immune parameters. Each node represents an immune parameter. Nodes are grouped by lineage and coloured by function; node size relates to the number of relationships. If any parameters were inherently related to other parameters due to the nature of flow analysis, only one parameter (of a correlated pair) was used in the correlation plot. e Plots depicting correlation between frequency of (left panel) IFN-γ+ γδ T cells and CD161-expressing γδ T cells; (middle panel) IFN-γ+ CXCL8− CD8 T cells and IFN-γ+ γδ T cells; and (right panel) CXCL8-producing CD4 and CD8 T cells. The data shown are a pool of longitudinal samples from 39 preterm babies, where each circle represents an individual sample and on average there are eight longitudinal samples per baby. Individual babies are in different colours. Source data are provided as a Source Data file.

