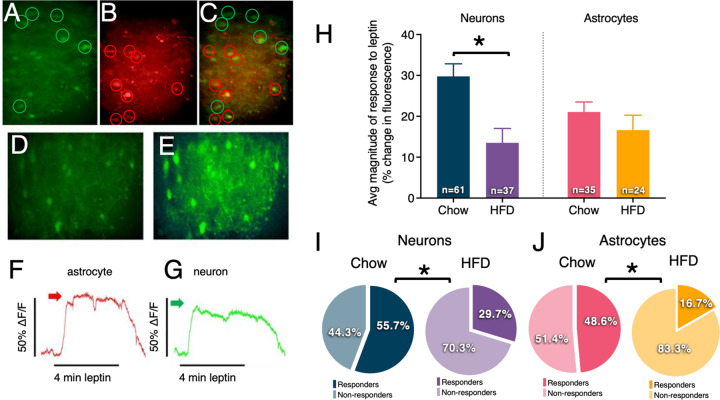
Fig. 2. Leptin-induced Ca+2 flux in DVC neurons and astrocytes vary by dietary status.
Live cell calcium recordings in DVC brain slices in astrocytes and neurons simultaneously. a Cells prelabeled with Cal520 (calcium sensitive dye; taken up by both neurons and astrocytes) encircled in green. b Cells prelabeled with SR101 (astrocyte-specific dye) are identified as astrocytes and encircled in red. c Yellow localization confirms that the calcium-sensitive dye is localized within astrocytes and distinguishable from neurons (green circle). d Total field of view (showing both neurons and astrocytes) at “rest” (i.e., baseline) and the same field of view shown in e at period of peak response leptin perfusion (see Supplementary Video 2 and 3). f Response to leptin perfusion of individual astrocyte marked by red arrow in g Response to leptin perfusion of individual neuron marked by green arrow in panel. Changes in fluorescence were measured in brain slices prepared from lean rats (n = 4) and rats exposed to a high-fat diet (n = 3) following bath leptin exposure (100ng/mL). h Magnitude of the leptin response was attenuated in neurons but not astrocytes of obese compared to lean animals. Obese animals had lower proportions of leptin-responsive (i) neurons and (j) astrocytes compared to lean animals. Changes in magnitude are represented as the mean ± standard error of the mean and were analyzed with a 2-way ANOVA and Bonferroni post hoc tests; *p < 0.05. Percentages of leptin-responsive cells were analyzed using Fisher’s exact test; *p < 0.05. See Supplementary Video 2 and Supplementary Video 3.

