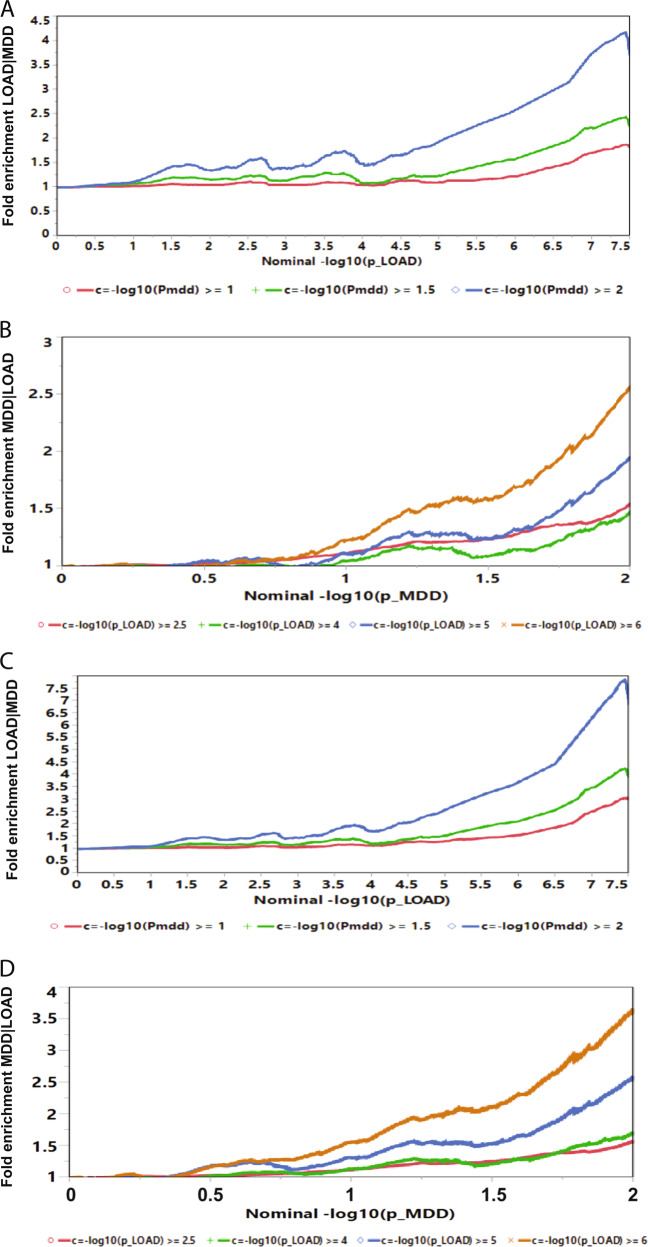
Fig. 1. Fold-enrichment plots.
Ordinate is fold enrichment. a Abscissa is nominal –log10(P) for SNP association with LOAD, curves are differentiated by the threshold for level of statistical significance for SNP association with the secondary phenotype (MDD). Plot is made for the results from the full genome. b Abscissa is nominal –log10(P) for SNP association with MDD, curves are differentiated by the threshold for level of statistical significance for SNP association with the secondary phenotype (LOAD). Plot is made for the results from the full genome. c Abscissa is nominal –log10(P) for SNP association with LOAD, curves are differentiated by the threshold for level of statistical significance for SNP association with the secondary phenotype (MDD). Plot is made for the results excluding SNPs in the APOE-associated region. d Abscissa is nominal –log10(P) for SNP association with MDD, curves are differentiated by the threshold for level of statistical significance for SNP association with the secondary phenotype (LOAD). Plot is made for the results, excluding SNPs in the APOE-associated region.

