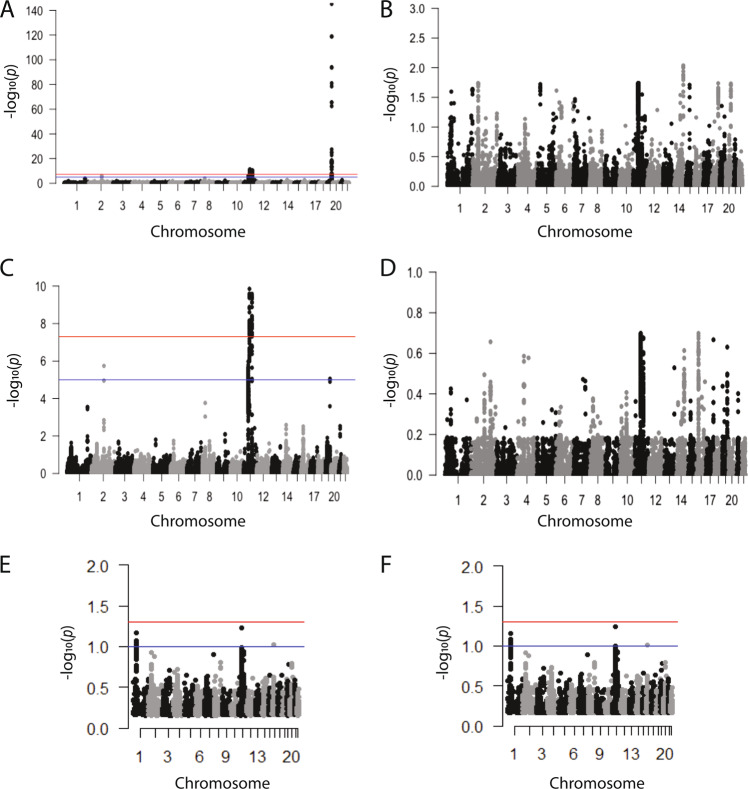
Fig. 2. Conditional Manhattan plots of the conditional –log10 (FDR) values.
a FDR Q value for SNP association with LOAD conditional with SNP association for MDD. Plot is made for the results from the full genome. b FDR Q value for SNP association with MDD association conditional with SNP association for LOAD. Plot is made for results from the full genome. c FDR Q value for SNP association with LOAD association conditional with SNP association for MDD. Plot is made for the results, excluding SNPs in the APOE-associated region. d FDR Q value for SNP association with MDD association conditional with SNP association for LOAD. Plot is made for the results, excluding SNPs in the APOE-associated region. e conjunction conditional FDR Q value for SNP association with LOAD conditional with SNP association for MDD. Plot is made for the results, including SNPs in the APOE-associated region. f Conjunction conditional FDR Q value for SNP association with MDD conditional with SNP association for LOAD. Plot is made for the results, excluding the APOE-associated region. For panels a–d, genome-wide significant line (red) is drawn at –log10(5 × 10⁻⁸), suggestive line (blue) is drawn at −log10(1 × 10⁻⁵); for panels e and f, genome-wide significant line (red) is drawn at –log10(0.05), suggestive line (blue) is drawn at –log10(0.1).

