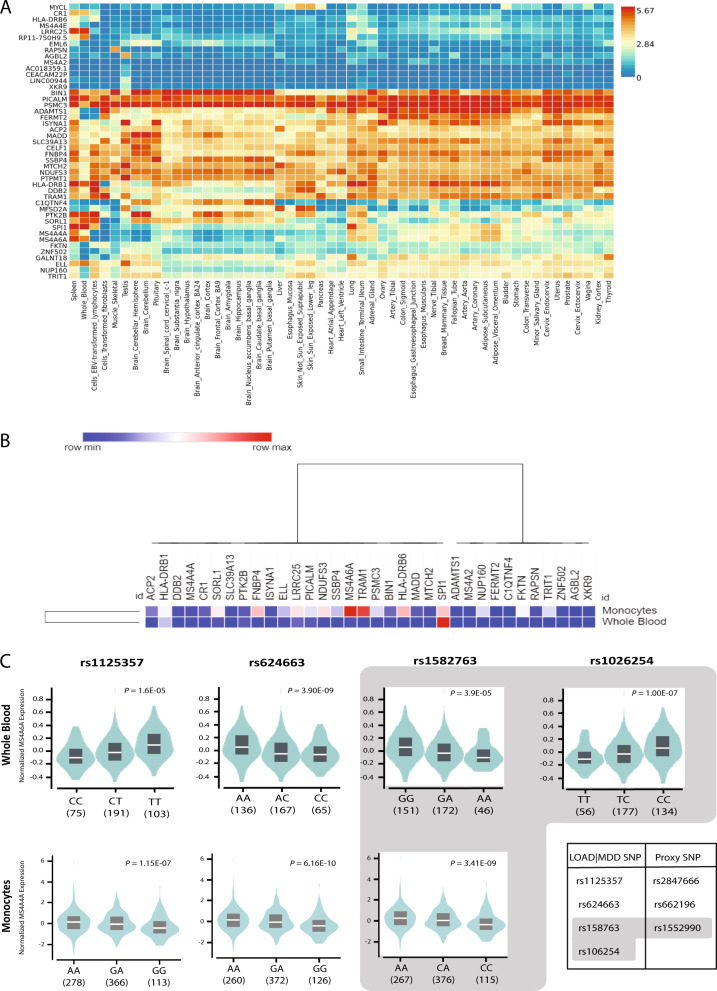
Fig. 3. Gene expression and eQTL analysis for genes associated with LOAD conditional on association with MDD.
a Heatmap plot of tissue-specific gene expression data in 53 GTEx tissue types for the 53 genes identified by proximity mapping for SNP association with LOAD, conditional with SNP association with MDD. There are 13 brain-specific tissues highlighted in the heatmap, which was ordered by both gene and tissue clustering. b Heatmap plot of expression levels of 53 genes in whole blood from the GTEx portal and in monocyte data from the Cardiogenics study. c Violin plots for eQTL analysis results in whole blood (upper panel) and in monocytes (lower panel) for SNPs identified as significant (FDR Q ≤ 5 × 10⁻⁸) for the association with LOAD conditional with association for MDD (Supplementary Table S5).

