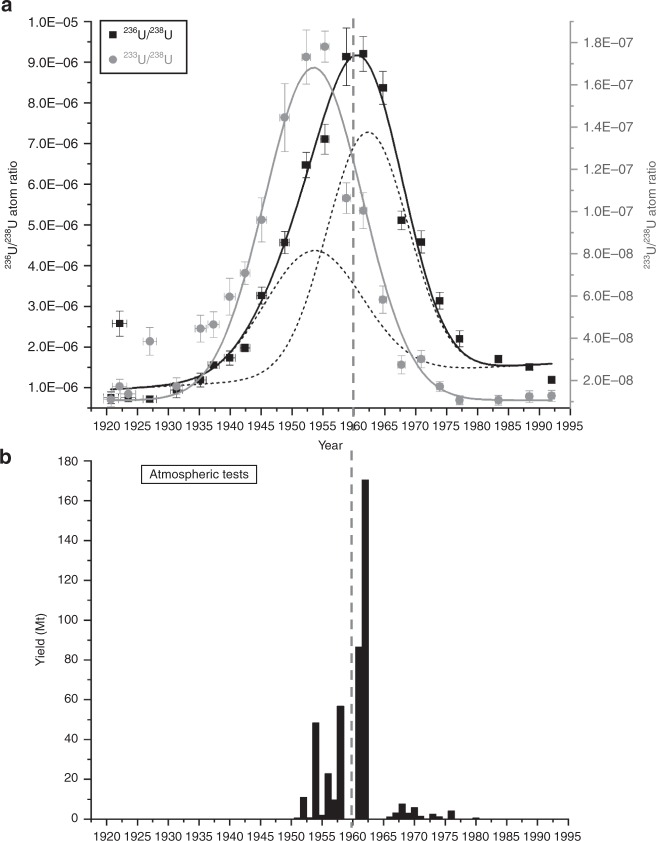
Fig. 1. U and U signal in the peat bog compared with weapons yields.
a Measured U/U (black squares) and U/U (gray dots) atom ratio in the peat core depending on the age of the peat layer. The measurement uncertainties shown are ±1 (s.e.m.). The solid lines represent a Gaussian fit of the U (black line) and the U (gray line) data indicating a time shift between the U and the U release. The U peak can be disentangled by two Gaussian distributions (dashed black curves in a) corresponding to the two major testing phases of nuclear weapons with respect to the explosion yield (1952–1958 and 1961–1962) shown in b39. The vertical dashed gray line marks the year 1960 for a direct comparison of the time scales in a and b.

