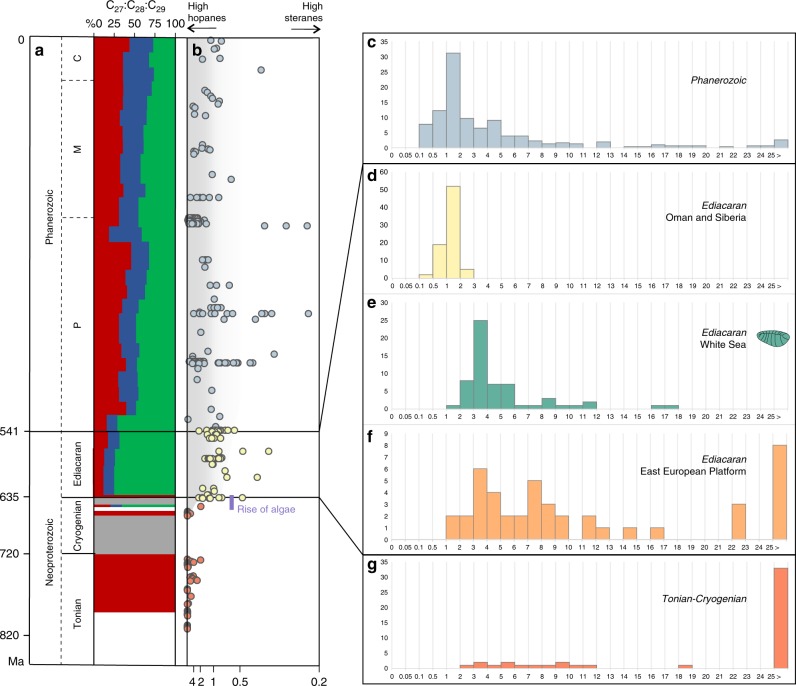
Fig. 2. Timeline through the Neoproterozoic and Phanerozoic and abundance information for hopanes and steranes.
a The relative abundance of the sterane homologues cholestane (C27, green), ergostane (C28, blue) and stigmastane (C29, green). Size of the coloured areas reflects relative sterane abundances. b Evolution of the relative abundance of bacterial hopanes over eukaryotic steranes (H/S) through time (orange = Tonian and Cryogenian; yellow = Ediacaran (data from Oman and Siberia); blue = Phanerozoic); the scale goes from H/S ~ ∞ (with no steranes detected) to H/S = 0.25, converted from the S/H ratio values from 0 to 4 in Brocks et al.15. Histograms showing the abundance distribution of H/S values for different periods and locations: c Phanerozoic biomarker data reported in the literature; d Ediacaran of the South Oman Salt Basin and the Siberian platform; e Ediacaran of the White Sea area; f previous biomarker analyses on the Ediacaran of the EEP (localities are marked as orange circles on Fig. 1); g Tonian and Cryogenian biomarker data reported in the literature. Data from the EEP from Pehr et al.17, data for the White Sea this study, all other data recalculated from Brocks et al.15.

