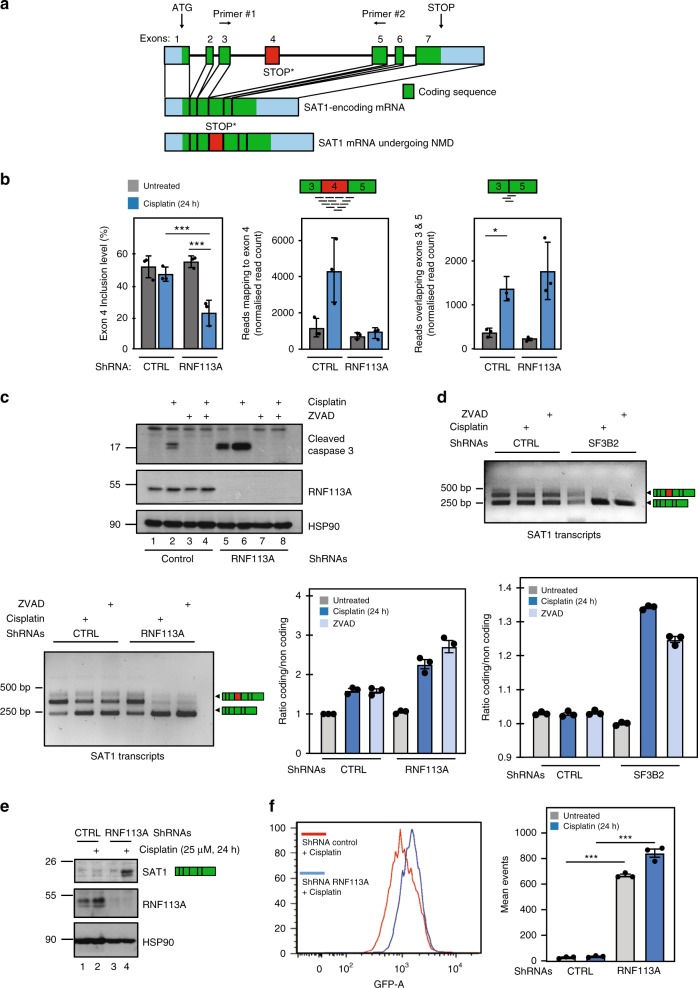
Fig. 6. RNF113A regulates the splicing of SAT1.
a–c RNF113A promotes SAT1 splicing. a Representation of SAT1 transcripts. The coding and non-coding sequences are illustrated as green and blue rectangles, respectively. A defective splicing of exon 4 (red rectangle) leads to a premature STOP codon. b rMATS results for the analysis of exon 4 skipping in SAT1 transcripts. The first barplot on the left represents the inclusion level of exon 4 in SAT1 transcripts in RNF113A-depleted or control cells, treated or not with Cisplatin. The middle and right plots represent the number of reads specific to transcripts with or without exon 4, respectively. Read counts have been normalized for differences in sample sequencing depth using DESeq2 size factor (median ratio method). Data were obtained from 3 replicates for each experimental condition (mean ± SD; Left panel: *** = FDR q-value < 0.001 from rMATS; Middle and right panels: *p < 0.05, two-sided T-test on normalized read counts). c, d RNF113A and SF3B2 deficiencies share common defects in SAT1 splicing. Transcripts are detected by RT-PCR experiments, using both primers depicted in a. Data for both control and RNF113A or SF3B2-depleted cells are shown (c and d, respectively). A quantification of all signals is illustrated for both experiments. On the top (c), WB analyses were done with control or RNF113A-depleted cells treated or not with Cisplatin (25μM for 24 h) and treated or not with ZVAD (20 μM for 24 h). e Enhanced SAT1 protein levels in Cisplatin-treated and RNF113A-deficient lung cancer cells. Control and RNF113A-depleted A549 cells were treated or not with Cisplatin (25 μM for 24 h) and WB analyses were done. f RNF113A deficiency triggers ferroptosis upon Cisplatin stimulation. Control and RNF113A-depleted A549 cells were treated or not with Cisplatin (25 μM) and lipid ROS were quantified by BODIPY-C11 staining, using a flow cytometer. Data from two experiments performed in triplicates are illustrated (mean ± SD) (***p < 0.001, Student t-test).

