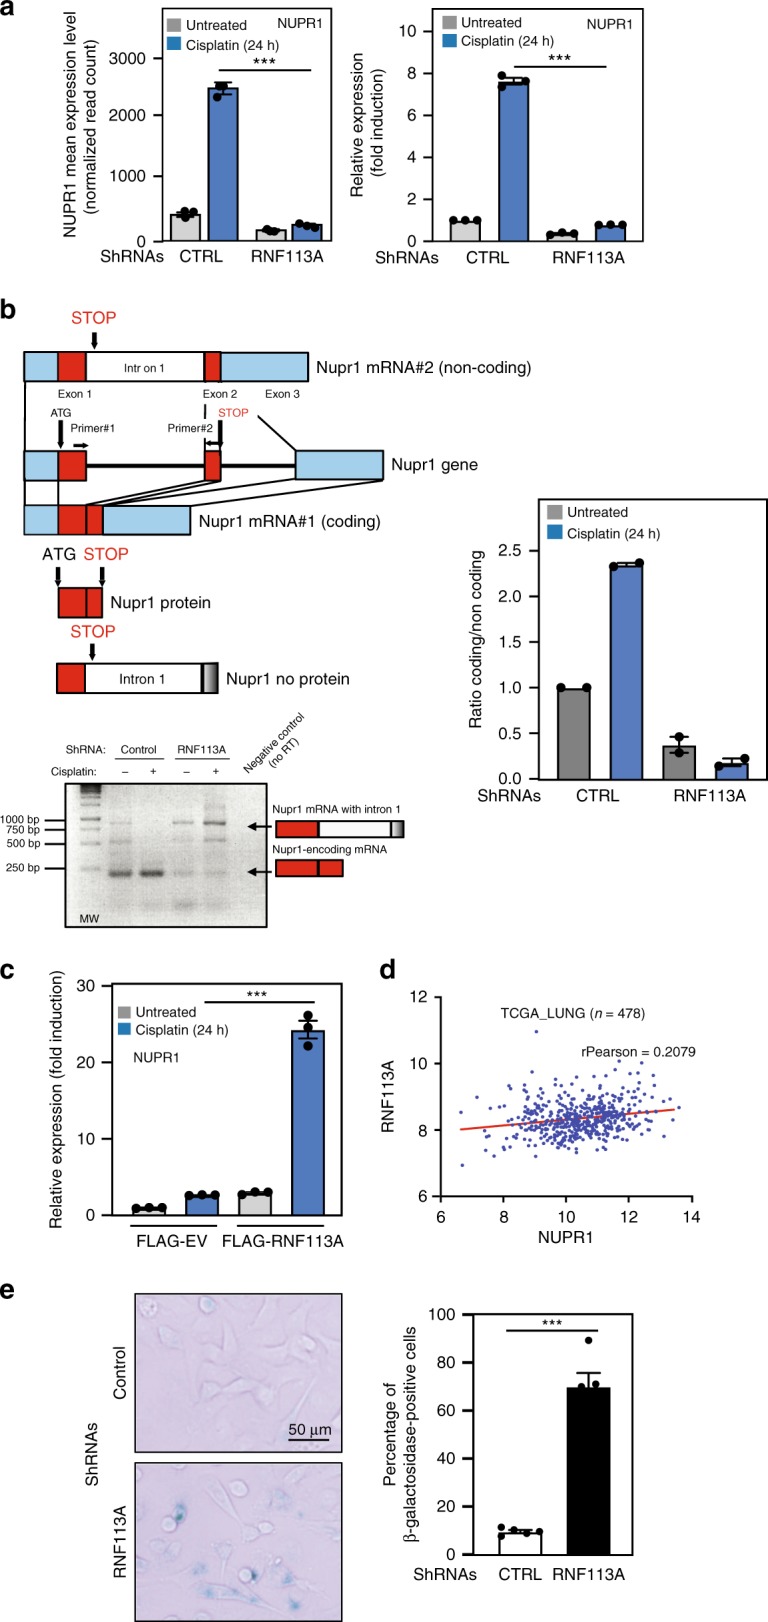
Fig. 7. RNF113A controls NUPR1 expression.

a RNF113A promotes Cisplatin-induced NUPR1 expression. The graph on the left represents the mean normalized number of reads mapping to NUPR1 gene in each experimental condition (mean ± S.D.; adjusted p-value from DESeq2 analysis of 3E-19 for the effect of RNF113A depletion, 9E-10 for cisplatin treatment and 4E−26 for the interaction between depletion and treatment, Supplementary Data 2). The graph on the right represents the level of NUPR1 mRNA in the same conditions. NUPR1 mRNA levels in unstimulated cells is set to 1 and levels in other experimental conditions are relative to that after normalization with β-actin. Data from two independent experiments performed in triplicates (means ± SD) (***p < 0.001, Student t-test). b RNF113A promotes the splicing of intron 1 from NUPR1 mRNA, especially upon Cisplatin treatment. A first transcript has a STOP codon within exon 2 and a second transcript includes intron 1. This transcript does not code for any protein due to a premature STOP codon within intron 1. At the bottom, RT-PCR experiments were done. The shorter and NUPR1-encoding transcript is preferentially detected in control cells. A quantification of all signals is illustrated on the right. c RNF113A promotes the expression of NUPR1-encoding mRNA. Real-Time PCRs were carried out with extracts from control versus RNF113A-overexpressing A549 cells treated or not with Cisplatin and mRNA levels of the NUPR1-encoding transcript were quantified in all experimental conditions. NUPR1 mRNA levels are plotted as in (a). Data are from two independent experiments performed in triplicates (means ± SD) (***p < 0.001, Student t-test). d RNF113A and NUPR1 expression are positively regulated in lung cancer (TCGA analyse, n = 478). e RNF113A-depleted cells undergo senescence. β-galactosidase staining in control or RNF113A-depleted A549 cells are shown. The percentage of β-galactosidase positive cells in each population is presented (means ± SD) (**p < 0.01, Student t-test).
