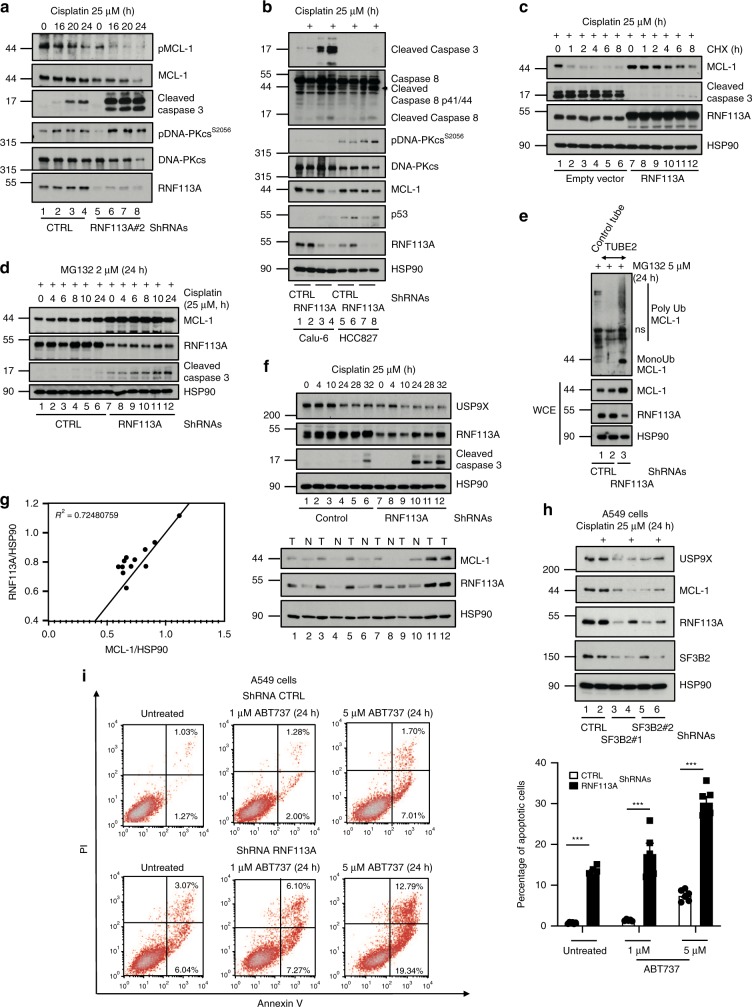
Fig. 9. RNF113A stabilizes MCL-1 protein levels.
a, b RNF113A controls MCL-1 expression in Cisplatin-treated cells. Control or RNF113A-depleted A549 (a), Calu-6 or HCC827 (b) cells were treated or not with Cisplatin and WB analyses were done. c RNF113A overexpression enhances MCL-1 protein half-life in Cisplatin-treated cells. Control or RNF113A-overexpressing cells were stimulated with Cisplatin and subsequently left untreated or stimulated with Cycloheximide (CHX) (50 μg/ml). WB analyses are illustrated. d RNF113A limits MCL-1 degradation by the proteasome upon stimulation by Cisplatin. Control or RNF113A-deficient A549 cells were simultaneously treated with MG132 (2 μM) and Cisplatin (25 μM). WB analyses are illustrated. e RNF113A deficiency enhances MCL-1 polyubiquitination. Protein extracts from control or RNF113A-depleted A549 cells treated with MG132 were incubated with TUBE 2 agarose beads to trap polyubiquitinated proteins (top panel) followed by anti-MCL-1 WB analyses. Crude cell extracts were also subjected to anti-MCL-1, -RNF113A, and -HSP90 WB analyses (bottom panels). f USP9X levels are decreased upon RNF113A deficiency in lung cancer cells. Control and RNF113A-depleted cells were untreated or stimulated with Cisplatin. WB analyses are illustrated. g RNF113A and MCL-1 protein levels are positively correlated in clinical cases of lung cancer. Cell extracts from clinical cases of lung cancer (T) and normal adjacent tissues (N) were subjected to WB analyses (right panel). Expression values (relative OD, as indicated) were plotted and the R-squared was calculated (left panel). h SF3B2 deficiency impairs RNF113A, USP9X and MCL-1 levels in lung cancer cells. Control or SF3B2-depleted A549 cells were treated or not with Cisplatin. WB analyses are shown. i RNF113A deficiency sensitizes lung cancer cells to BCL-2 inhibition. Control or RNF113A-depleted A549 cells were untreated or incubated with ABT737 for 24 h. FACS analyses to quantify the percentage of cells undergoing early or late apoptosis are illustrated. On the right, FACS data from two independent experiments are illustrated in the histogram (Student t-test, ***p < 0.001).

