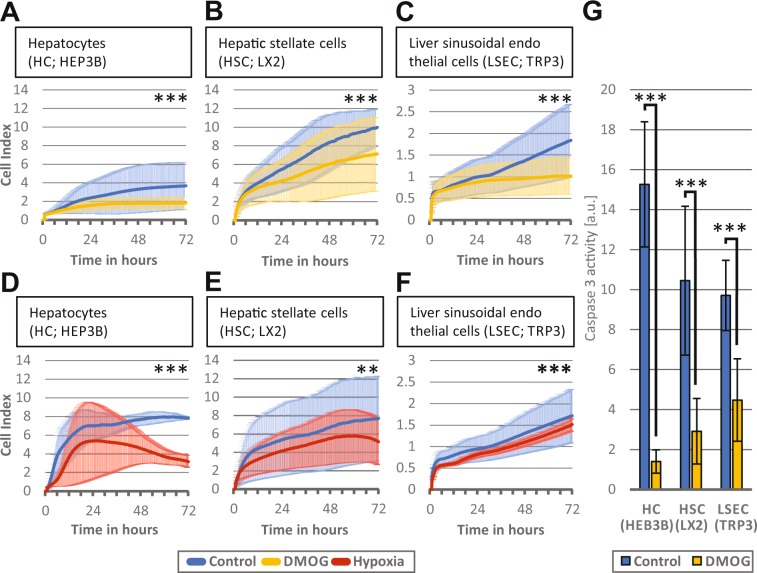
Figure 2.
Effect of hypoxic signaling and hypoxia on liver cells in vitro. The iCELLigence system measures cell proliferation by impedance and thereby assesses proliferation of about 4500 plated cells over a time continuum. Bold lines represent mean values of the individual measurements, shadowed lines represent the SD of individual measurements. (A) Hepatocytes (HC) proliferation over 72 h after incubation with 1 mM dimethyloxalylglycine (DMOG) (B) Hepatic stellate cells (HSC) proliferation over 72 h after incubation with 1 mM DMOG and (C) Liver sinusoidal endothelial cells (LSEC) proliferation over 72 h after incubation with 1 mM DMOG. Control cells were exposed to phosphate-buffered saline instead of DMOG. (D, E, F) Proliferation of the 3 respective types were also cultivated in hypoxic conditions of 2% O, and proliferation was measured over 72 h. (G) HC, HSC, and LSEC were incubated with 1 mM DMOG for 72 h and caspase 3 activity was measured and normalized to the DNA content. A-F: n = 3 independent experiments (cell passages with two measurements) were performed for each group A-F and representative graphic outputs for each experiment are shown here: **p < 0.01; ***p < 0.001.

