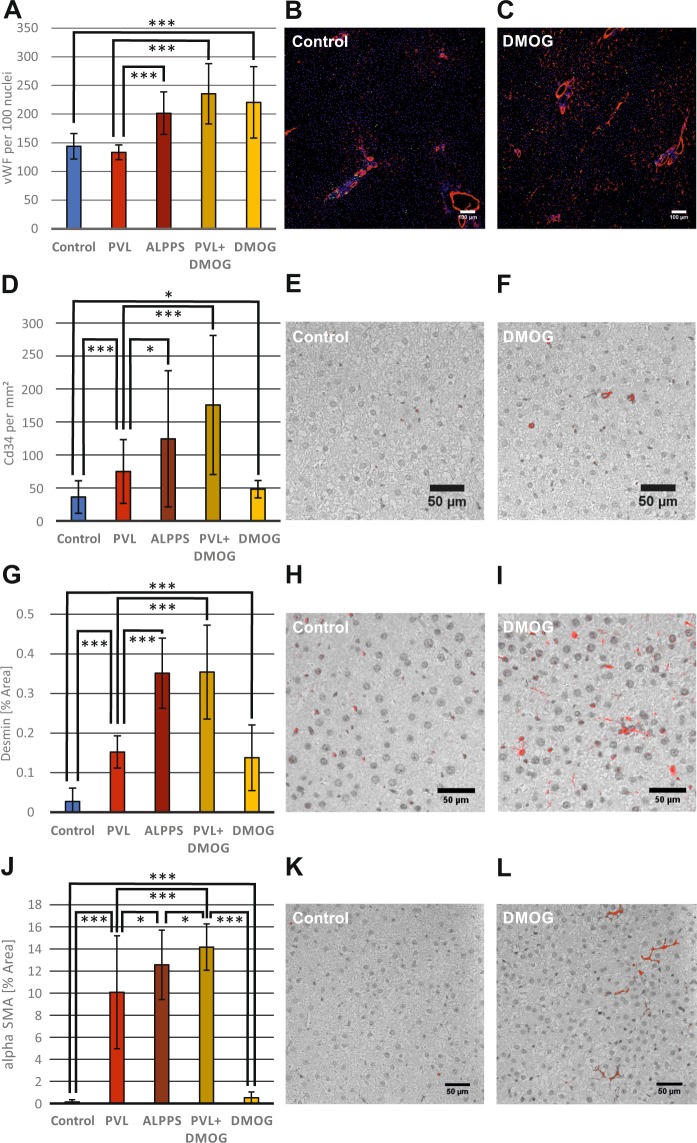
Figure 4.
Angiogenesis in rapid liver regeneration models and the activation of hepatic stellate cells in vivo. (A) Histological quantification of the endothelial marker von Willebrand factor (vWF) after immunofluorescence staining. Regions of interest (ROI) of the right middle lobe (RML) were examined in rat models of PVL, ALPPS, PVL+DMOG, DMOG and control. Microvascular cross sections with a diameter below 20 µm were counted and related to DAPI-positive nuclei. (B,C) Representative photomicrograph of immunofluorescence staining for vWF (red), the proliferation marker Ki67 (green) and DAPI nuclear staining (blue) of rat liver RML 72 h after intraperitoneal phosphate-buffered saline (control) or DMOG administration. (D) Histological quantification of CD34, which is expressed in endothelial cells only during their differentiation, in immunohistochemistry staining. ROI of the right middle lobe (RLM) were evaluated 72 h after PVL, ALPPS, PVL+DMOG, DMOG and controls. CD34-positive areas were marked red using the threshold function of Image J, counted and expressed as counts per mm2. (E,F) Representative photomicrograph of immunohistochemistry with CD34 of rat liver RML 72 h after DMOG administration or control. (G) Histological quantification of desmin, a marker for activated HSC, in immunohistochemistry staining. ROI of the right middle lobe (RLM) were evaluated 72 h after PVL, ALPPS, PVL+DMOG, DMOG and controls. The desmin-stained area was marked red using the threshold function of Image J, measured and expressed as percent of the total area. (H,I) Representative photomicrograph of immunohistochemistry with desmin of rat liver RML 72 h after DMOG administration or control. (J) Histological quantification of α-smooth-muscle actin (αSMA), a histological marker for stellate cells in immunohistochemistry staining. ROI of the right middle lobe (RLM) were evaluated 72 h after PVL, ALPPS, PVL+DMOG, DMOG and controls. The area stained for αSMA was marked red using the threshold function of Image J, measured and expressed as percent of the total area. (K,L) Representative photomicrograph of immunohistochemistry with αSMA of rat liver RML 72 h after DMOG administration or control. n = 5 animals for controls and DMOG alone, n = 4 for ALPPS, PVL and PVL+DMOG. 10 ROIs per animal were counted. *p < 0.05; ***p < 0.001.

