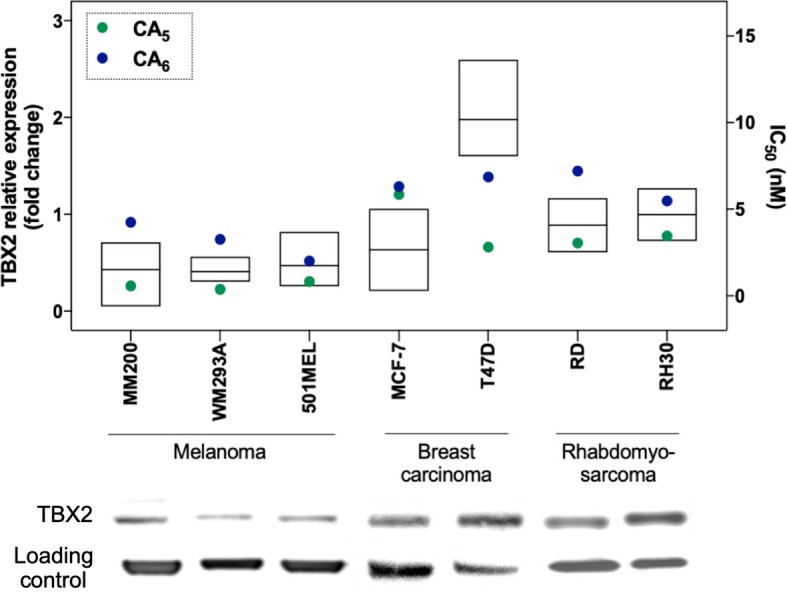
Figure 2.

Relative protein expression of TBX2 and cytotoxicity (IC50) data in melanoma, breast cancer, and rhabdomyosarcoma cell lines. Protein expression levels are plotted in the left y axis as ratio signals for TBX2/respective loading control obtained from the densitometry readings using UN-SCAN-IT gel 6.1 software. Loading controls were obtained using α-tubulin for melanoma and breast carcinoma cells, and P-38 for sarcoma cells. IC50 values are represented in the right y axis and were obtained by the MTT assay cytotoxicity readings after 72 h exposure of drugs to the respective cell line and analyzed by non-linear regression using GraphPad Prism version 8.0 (GraphPad Software, USA) from three independent experiments performed in duplicate.
