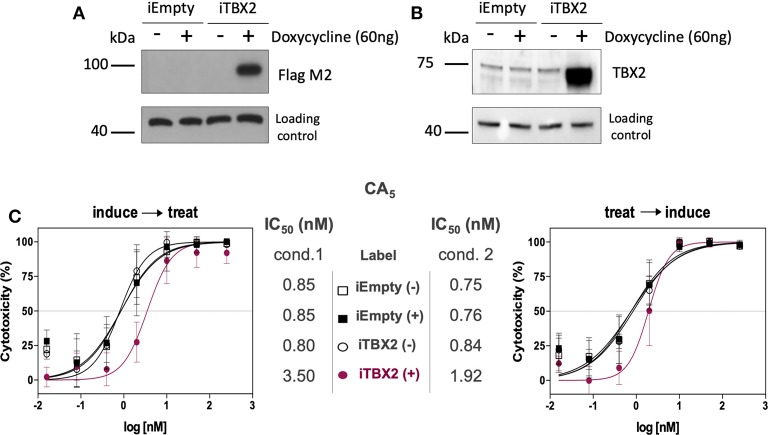
Figure 4.
Cell viability assay (MTT) of CA5 in 501mel cells with induced and non-induced TBX2-overexpression. (A,B) Western blot membranes of samples from iEmpty and iTBX2 cells, without (−) and with (+) 60 ng/mL doxycycline, showing that only iTBX2 (+) is inducing TBX2 overexpression; A—probed for anti-Flag M2; B—probed for anti-TBX2. (C) CA5 cytotoxicity profiles and respective IC50 (nM) values accessed under cond.1 and cond.2 after 48 h drug exposure. IC50 values were obtained by non-linear regression using GraphPad Prism version 8.0 (GraphPad Software, USA) from three independent experiments performed in duplicate. Cond.1, experiment setup where induction of TBX2 expression was done before drug treatment; Cond.2, experiment setup where drug treatment was done prior to TBX2 induction.

