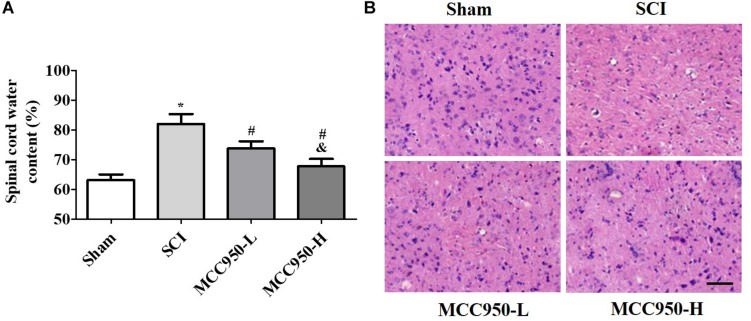
FIGURE 2.
MCC950 alleviated spinal edema in vivo. (A) Measurement of spinal edema in mice in the MCC950 and SCI groups. (B) Representative images of the histological appearance of spinal cord transverse sections after H&E staining. Scale bars: 100 μm. Data are reported as the mean ± SEM, n = 9. One-way ANOVA followed by Tukey’s multiple comparison test, *p < 0.05, vs. sham; #p < 0.05, vs. SCI; &p < 0.05, vs. MCC950-L. MCC950 (L: 10 mg/kg, H: 50 mg/kg). SEM, standard error of the mean.

