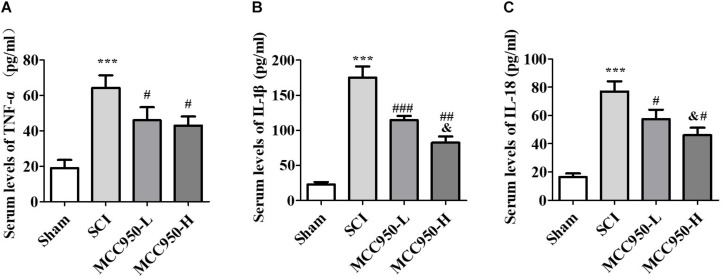
FIGURE 5.
Serum levels of TNF-α (A), IL-1β (B), and IL-18 (C) at 7 days post-SCI. There was a notable decrease in the TNF-α, IL-1β, and IL-18 levels in the MCC950 (L and H) groups compared to the SCI group. Data were reported as the mean ± SEM, n = 9. One-way ANOVA followed by Tukey’s multiple comparison test, ***p < 0.001, vs. sham. #p < 0.05, ##p < 0.01, ###p < 0.01, vs. SCI. &p < 0.05, vs. MCC950-L. MCC950 (L: 10 mg/kg, H: 50 mg/kg). SEM: standard error of the mean.

