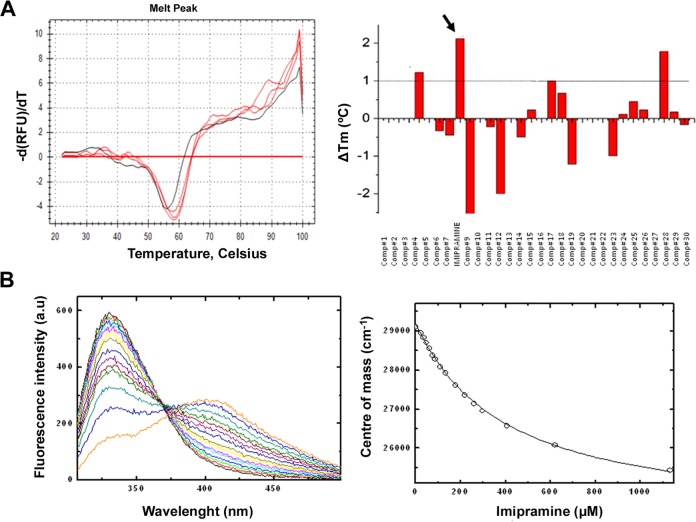
Fig. 2. In vitro validation of imipramine binding to fascin1.
a Differential scanning fluorimetry assays. The right panel shows the first derivative of the thermal denaturation profiles of fascin1 in the absence (black) and in the presence of 1 mM imipramine (red in triplicate). The left panel summarizes the changes in Tm induced by the presence of the selected compounds at 1 mM in 10% DMSO. b Fluorescence titration. The right panel shows the fluorescence emission spectra of fascin1 in the presence of increasing concentrations of imipramine. The left panel shows the binding isotherm. White circles represent the center of mass of the different spectra, and the continuous lines symbolize the best fit of the data to a one-site binding model.

