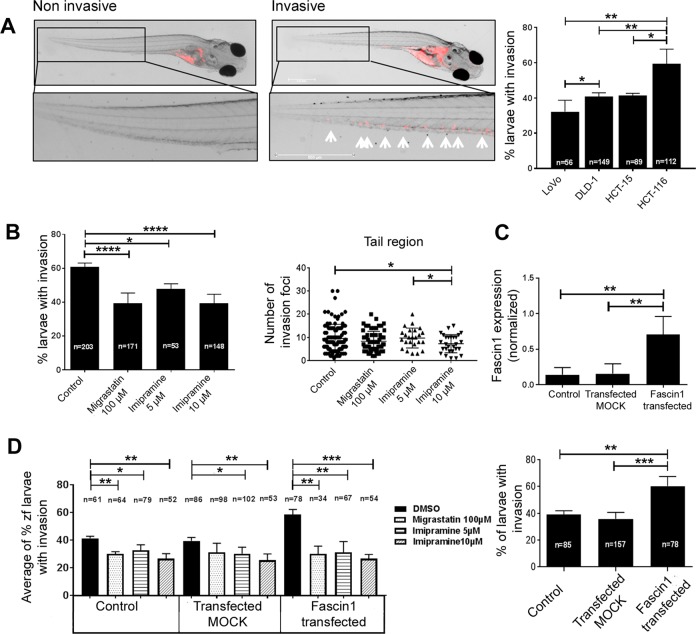
Fig. 7. Zebrafish invasion assays 4 days post xenograft.
a The images show the invasive and noninvasive cells in a zebrafish invasion model. The invasiveness of each cell line in this model is shown in the right panel. b HCT-116 cancer cells were treated with migrastatin and imipramine and then injected into zebrafish larvae. The effect of imipramine in diminishing the cell invasion percentage and the number of invasive cells is similar to that of migrastatin. c Fascin1 mRNA levels in transfected DLD-1 cells and cell invasion associated with transfection (lower panel). d Effect of drugs on the average percentage of zebrafish larvae invasion in fascin1-transfected DLD-1 cells. Data are shown as the mean ± SD, compared with the control, *p = 0.049–0.01; **p = 0.001–0.009; ***p = 0.0001–0.0009; ****p < 0.0001.

