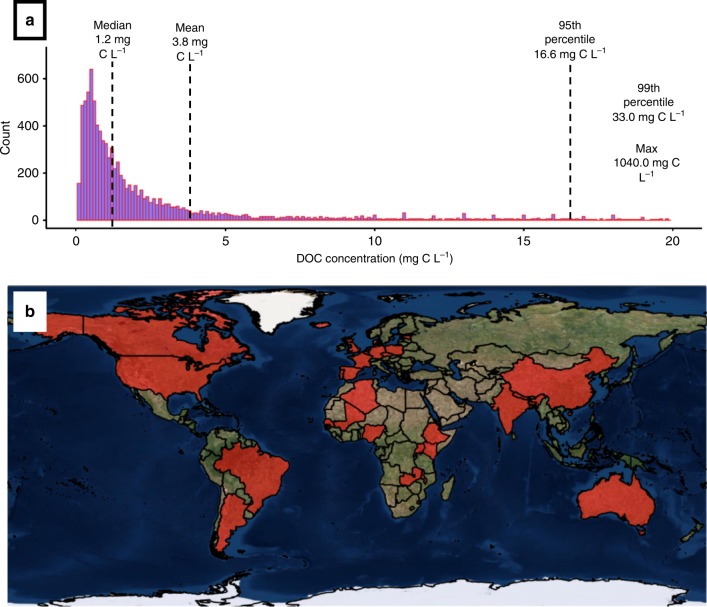
Fig. 1. Global groundwater DOC concentrations.
a Histogram showing global groundwater DOC concentrations (mg C L−1). Sample sizes for individual countries ranged from 5 to 5,812, with 14 out of 32 countries having n < 30. We have therefore presented aggregated data. Samples above 20 mg C L−1 are not included in the graph for clarity (n = 337). The black dashed lines indicate the global median (1.2 mg C L−1) and mean (3.8 mg C L−1) and 95th percentile (16.6 mg C L−1) values, respectively. Also shown are the 99th percentile value and the maximum value (33.0 and 1040.0 mg C L−1, respectively). b Countries from which groundwater DOC data were obtained are shown in red.

