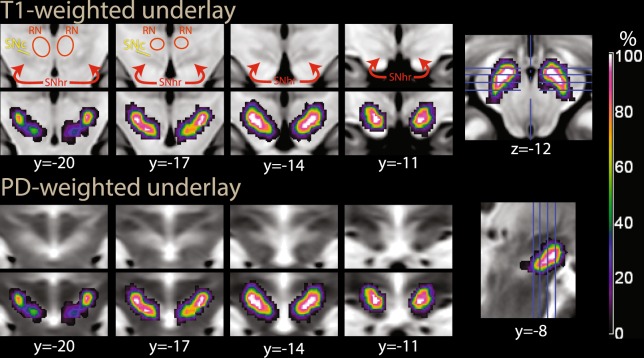
Figure 3.
Segmentation of the substantia nigra and red nucleus in the second experiment, as in Fig. 2a, overlaid on T1-weighted (top) and proton density-weighted (bottom row) images from the ICBM atlas. In T1-weighted images, the iron-rich region of the substantia nigra is slightly hypointense (SNhr). In proton density-weighted images, it is enclosed in a slightly hyperintense area. The color scale refers to the percent of individuals in which the voxel was classified as belonging to the hypointense region in the T2*-weighted EPI images. MNI coordinates, abbreviations as in Fig. 2a.

