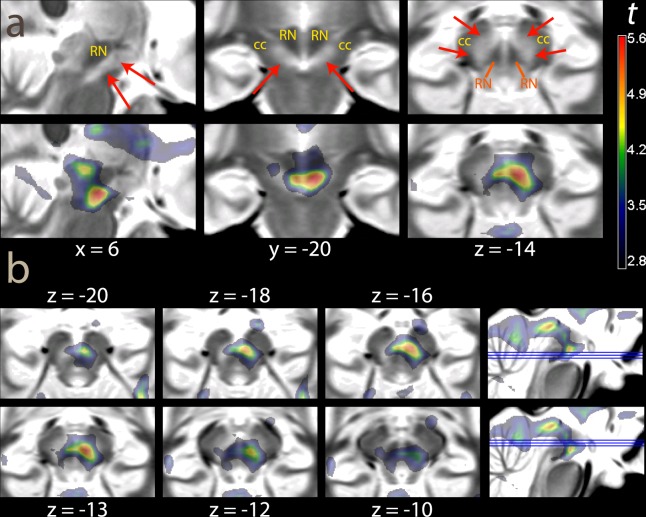
Figure 5.
Overlays showing the effect of reward levels in the foraging phase (data smoothed FWHM 6 mm for improved resolution) on a proton-density weighted template brain. (a) Statistical maps centered at the pial voxel. In the upper row, the template image without overlay. The SN is visible as a brighter strip of tissue (red arrows), while the crus cerebri (cc) has a darker appearance. Note that here, in contrast to Fig. 2a, there is no contrast between the iron-rich portion of SN and the rest. RN: red nucleus. (b) Transversal slices. Montreal Neurological Institute coordinates. The thresholding for visualization and the color scale are the same as in Fig. 4.

