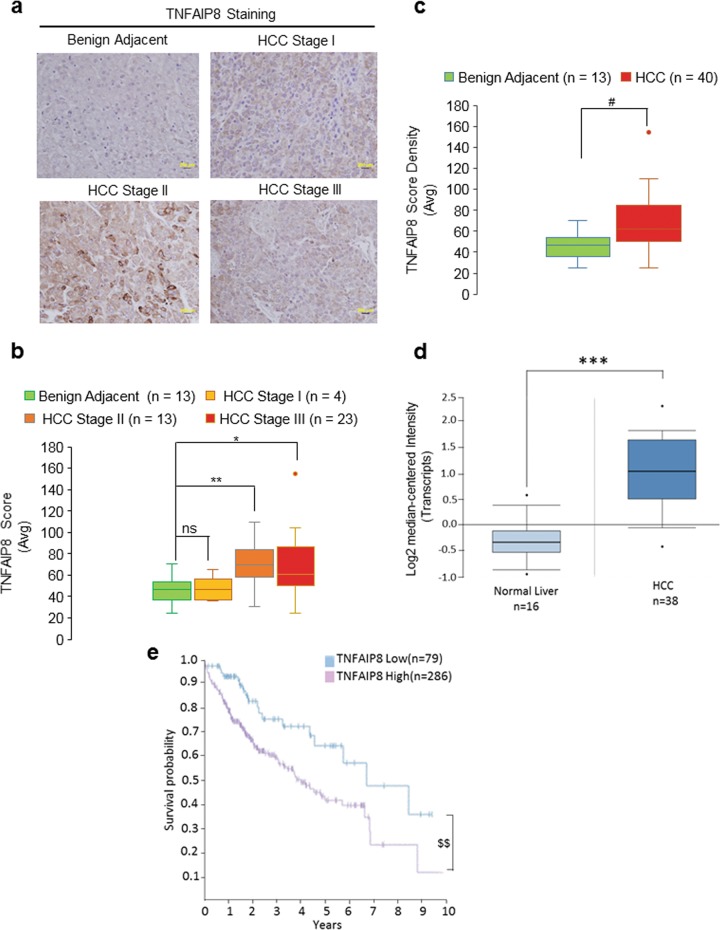
Fig. 1. Higher TNFAIP8 expression is associated with liver cancer progression.
a Representative images of tumor microarray (TMA) of TNFAIP8 expression in different stages of liver cancer. b Expression levels of TNFAIP8 protein in normal livers, stage I, stage II, and stage III HCC tumors were quantified from TMA. Boxplots show median and interquartile ranges with whiskers indicating the total range of TNFAIP8 expression. The data represent mean from 4 to 23 HCC tissues. *P < 0.05, **P < 0.01, ns—not significant relative to benign adjacent tissues. c The overall quantification of TNFAIP8 expression in benign adjacent liver tissues and HCC tumors with different stages was quantified from TMA. Boxplots show median and interquartile range with whiskers indicating the total range of TNFAIP8 expression. The data represent mean from 13 to 40 HCC tissues. #P < 0.05 statistical significance relative to benign adjacent tissues. d Expression of TNFAIP8 transcripts between normal liver and HCC tumors were presented from Oncomine data set. (https://www.oncomine.org/resource/login.html; accessed October 7, 2019). ***P < 0.001 compared with normal liver. e Effect of low and high TNFAIP8 expression and related liver cancer patient survival probabilities reported in ‘The Human Protein Atlas’ was presented (https://www.proteinatlas.org/search/TNFAIP8; accessed November 12, 2018). $$P < 0.01 statistical significance relative to low TNFAIP8 expression.

