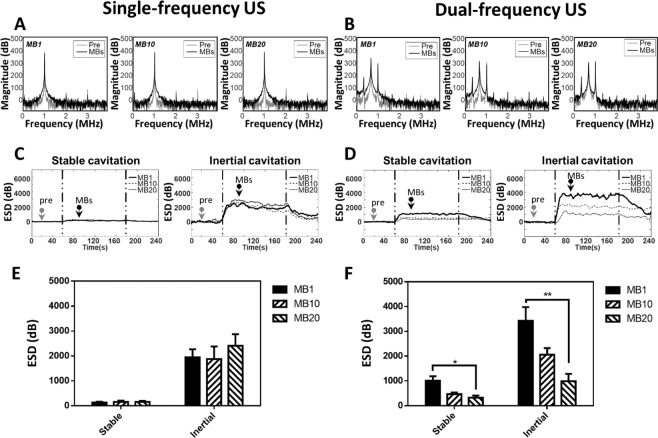
Figure 2.
Energy spectral density in single-frequency US sonication and dual-frequency US sonication for various MB concentrations. Typical spectrum was shown in (A,B), which was at time point 20 sec (pre, as gray arrow) and 90 sec (MBs, as black arrow). Energy spectra in stable cavitation acquired from PCD during (C) single-frequency US sonication and (D) dual-frequency US sonication. Quantification of the ESD of SCD and ICD in panels A, C and B, D was shown in (E,F), respectively. (n = 5) (*p < 0.05, **p < 0.01). Data are mean and SD values.

