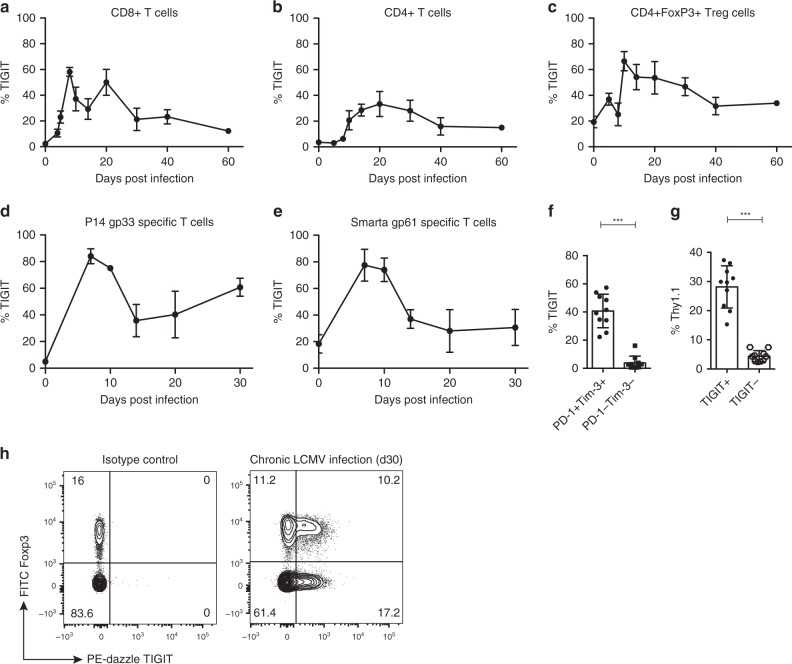
Fig. 1. TIGIT expression during chronic LCMV clone 13 infection.
TIGIT expression on splenic T cells was analyzed after chronic LCMV clone 13 infection (2 × 10⁶ FFU) using flow cytometry. Expression over time on (a) CD8+ T cells, (n = 2–16), (b) CD4+ T cells (n = 2–17), and (c) CD4+FoxP3+ regulatory T cells (n = 2–13) is shown. TIGIT expression on (d) P14 Ly5.1+ TCR transgenic CD8+ T cells specific for gp33, (n = 4–6) and (e) Smarta CD4+ T cells specific for gp61 (n = 4–7). f TIGIT expression on exhausted (PD1+Tim-3+) or non-exhausted (PD1−Tim-3−) CD8+ T cells on day 30 p.i. (n = 10). g IL-10-Thy1.1 expression in Thy1.1-IL-10 reporter mice by TIGIT+ and TIGIT- CD8+ T cells on day 30 p.i. (n = 10). h Representative FACS plots of TIGIT expression on T cells on day 30 p.i. with chronic LCMV clone 13. Data represent 2–3 independent experiments. Each symbol in the scatter plot represents an individual mouse, and bar graphs indicate the mean value ± SD. Statistical values p < 0.05 (*), p < 0.01 (**), p < 0.005 (***) or ns (not significant, p > 0.05) determined by Welch’s t test.

