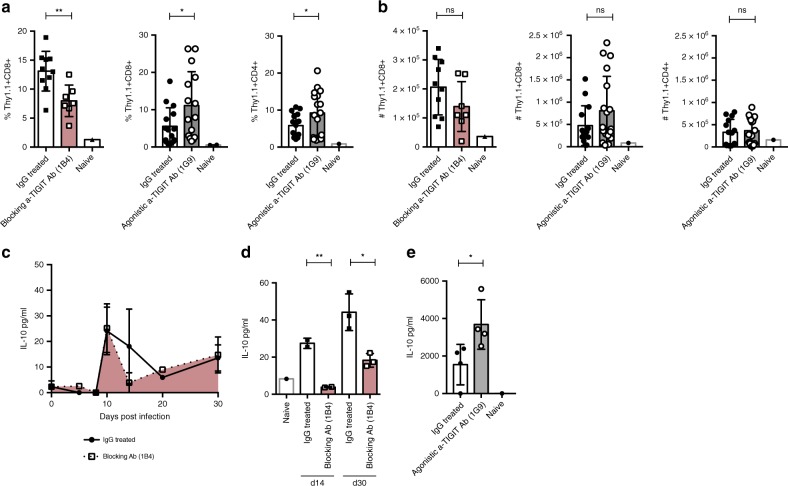
Fig. 3. TIGIT modulation correlates with IL-10 production in vivo.
Thy1.1-IL-10 mice were infected with either 2 × 10⁶ FFU LCMV clone 13 i.v. (red) or 1 × 10⁵ FFU LCMV clone 13 i.v. (gray). Chronically infected mice (red) were treated with 100 μg of blocking anti-TIGIT (1B4) Ab or mouse IgG1 i.p., acutely infected mice (gray) were treated with 100 μg of agonistic anti-TIGIT (1G9) Ab or mouse IgG1 i.p. a IL-10-Thy1.1 expression on splenic CD8+ on day 30 p.i. in chronically infected mice (red) and on CD8+ and CD4+ T cells on day 14 p.i. in acutely infected mice (gray) is shown (n = 7–17). b Absolute numbers of IL-10-Th1.1+ CD8+ on day 30 p.i. in chronically infected mice (red) and of IL-10-Th1.1+ CD8+ and IL-10-Th1.1+ CD4+ on day 14 p.i. in acutely infected mice (gray) are depicted (n = 7–13). IL-10 protein levels were measured by cytometric bead assay in (c) the serum of chronically (d30 p.i.) infected mice (n = 1–6 sera pooled from three mice) and (d) supernatants of ex vivo cultured splenocytes isolated on day 30 p.i. after chronic LCMV clone 13 infection re-stimulated with anti-CD3 (n = 3, pooled from nine mice) and (e) supernatants of ex vivo cultured splenocytes isolated on day 14 after acute LCMV clone 13 infection re-stimulated with anti-CD3 (n = 4). Pooled data from two to three independent experiments are shown. Each symbol in the scatter plot represents an individual mouse or pooled data point and bar graphs indicate the mean value ± SD. Statistical values p < 0.05 (*), p < 0.01 (**), p < 0.005 (***), or ns (not significant, p > 0.05) were determined by Welch’s t test.

