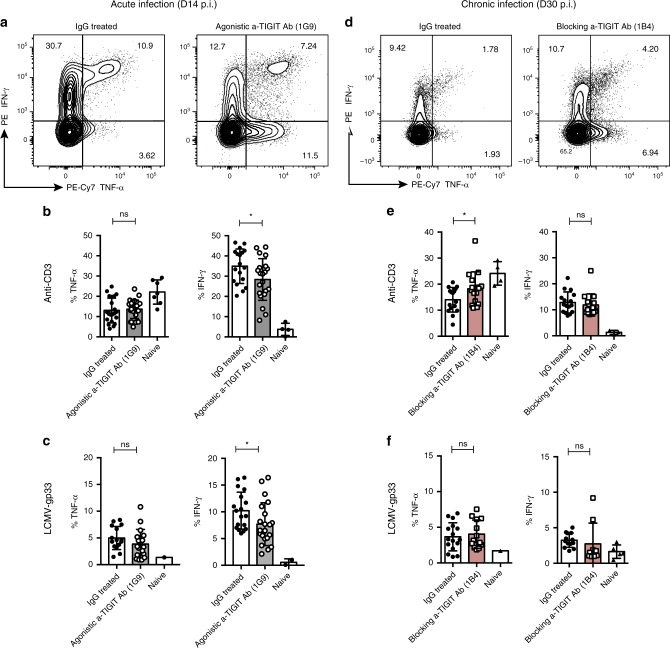
Fig. 4. TIGIT ligation results in decreased pro-inflammatory cytokine production after acute infection.
C57BL/6 mice were infected with either 2 × 10⁶ FFU LCMV clone 13 i.v. (red) or 1 × 10⁵ FFU LCMV clone 13 i.v. (gray). Chronically infected mice (red) were treated with 100 μg of blocking anti-TIGIT (1B4) Ab or mouse IgG1 i.p., acutely infected mice (gray) were treated with 100 μg of agonistic anti-TIGIT (1G9) Ab or mouse IgG1 i.p. a, d Representative FACS plots displaying pro-inflammatory cytokine expression of splenic CD8+ T cells after acute infection (gray) and chronic infection (red) (b) on day 14 p.i. with acute LCMV clone 13. FACS-based quantification of pro-inflammatory cytokine production by splenic CD8+ T cells after anti-CD3 re-stimulation (n = 18–22) (c) on day 14 p.i. after gp33 re-stimulation (n = 13–20). FACS-based quantification of pro-inflammatory cytokine production by splenic CD8+ T cells after (e) after anti-CD3 re-stimulation (n = 15–25) (f) after gp33 re-stimulation (n = 9–16). Each symbol in the scatter plot represents an individual mouse, and bar graphs indicate the mean value ± SD. Statistical values p < 0.05 (*), p < 0.01 (**), p < 0.005 (***), or ns (not significant, p > 0.05) determined by Student’s t test.

