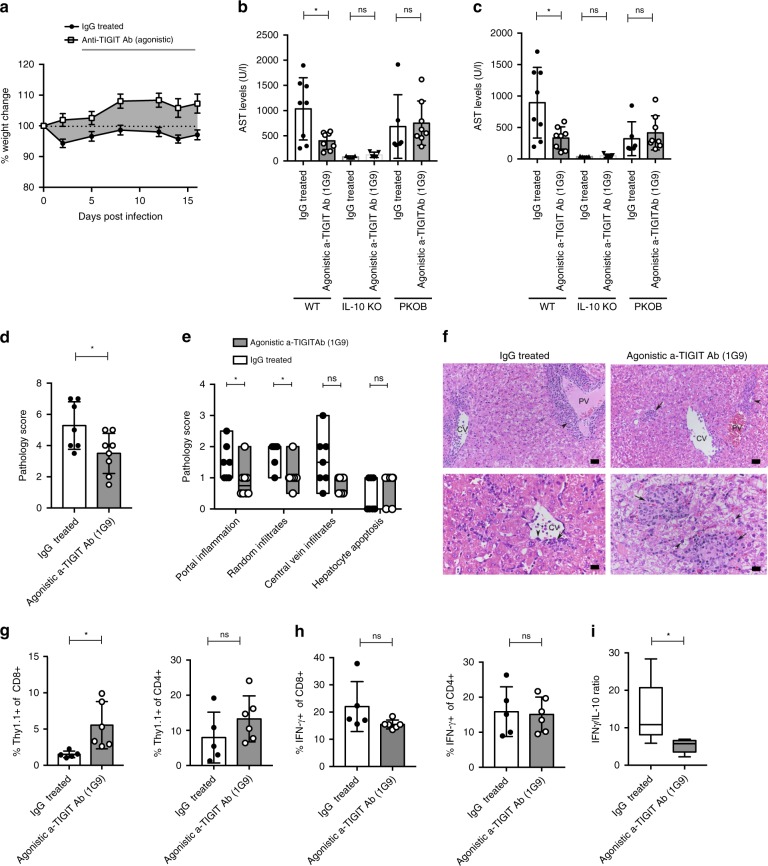
Fig. 6. TIGIT engagement limits immune-mediated tissue pathology in the liver after acute virus challenge.
C57BL/6, Thy1.1-IL-10 reporter, IL-10 KO, or PKOB mice were infected with 1 × 10⁵ FFU LCMV clone 13 i.v. and treated with 100μg control IgG1 or anti-TIGIT Ab (1G9) on days 0, 2, 4, and day 10 i.p. a The body weight of acutely infected mice over the course of infection with or without anti-TIGIT Ab (1G9) treatment is shown (n = 10). Serum levels of AST (b) and ALT (c) quantified by enzymatic activity assay on day 14 p.i. from WT, IL-10 KO, and PKOB mice are shown (n = 5–8). d–f Tissue damage was assessed in liver sections 14 days after infection using hematoxylin and eosin (H&E) staining. Overall pathology (d), classification of histopathological damages (e) and representative light microscopy images (f) are depicted (n = 7–8). Arrows indicate leukocyte recruitment and infiltration or dying hepatocytes. CV central vein, PV portal vein. Scale bar = 20 μm. g–i Cytokine production by T cells in the liver of IgG1 and anti-TIGIT Ab (1G9)-treated mice was determined by FACS on day 14 p.i. g Absolute numbers of IFN-γ+ CD8+ and CD4+ T cells after anti-CD3 re-stimulation. h Frequency of IL-10-Thy1.1+ CD8+ and CD4+ T cells (i) and the ratio of total IFN-γ+ to IL-10+ CD8+ T cells are displayed (n = 5–9). Pooled data from two independent experiments are shown. Each symbol in the scatter plot represents an individual mouse, and bar graphs indicate the mean value ± SD. Statistical values p < 0.05 (*), p < 0.01 (**), p < 0.005 (***), ns (not significant, p > 0.05) determined by Student’s t test (two experimental groups) or one-way ANOVA (more than two experimental groups). Histopathological data were evaluated using two-tailed Mann–Whitney test.

