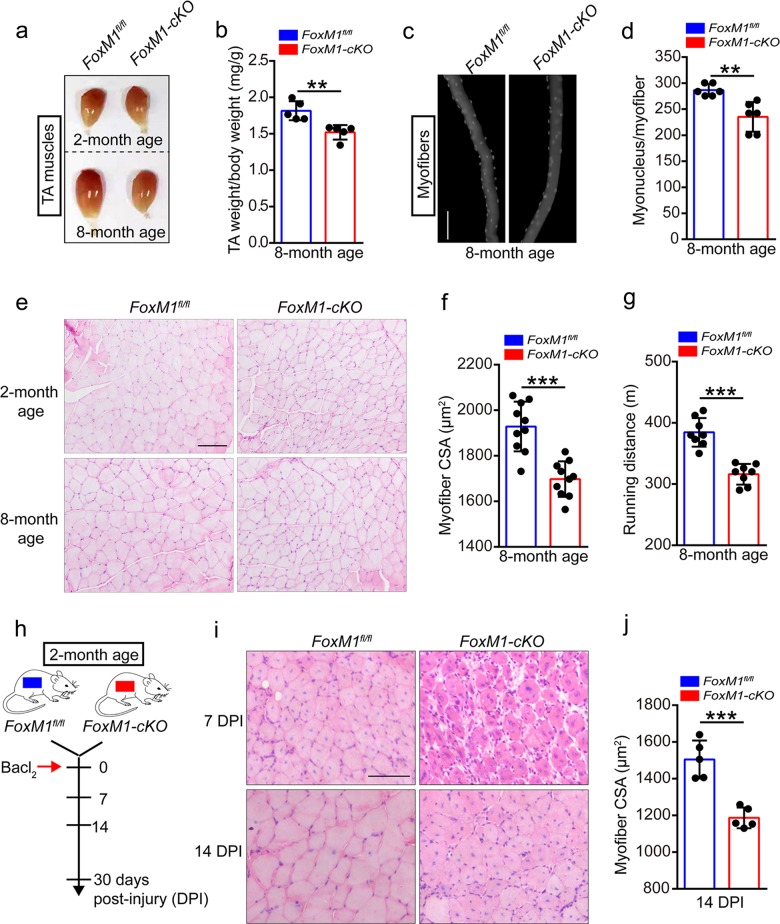
Fig. 1. FoxM1 deficiency results in muscle atrophy and impairs muscle regeneration.
a The visual comparison of muscle mass of tibialis anterior (TA) in FoxM1 deletion mice compared with control mice at 2 or 8 months of age. b Quantification of TA weight/body weight in FoxM1fl/fl and FoxM1-cKO mice at 8 months of age (n = 5). c, d Immunofluorescence of myonucleus on single myofiber by DAPI staining (c) and number count (d) (n = 6, 20 myofibers per mouse). Scale bar, 100 μm. e Hematoxylin and eosin (HE) staining of the TA muscle cross-sections in mice at 2 or 8 months of age. Scale bar, 100 μm. f Average cross-section area (CSA) of TA in FoxM1fl/fl and FoxM1-cKO mice at 8 months of age (n = 10). g The maximum running distance (measured by a treadmill) of FoxM1-cKO mice compared with control mice at 8 months of age (n = 8). h A schematic illustration showing the experimental design for muscle injury. BaCl2 was injected into and along the length of TA and gastrocnemius muscle of mice (2 months of age). The skeletal muscle or TA muscle was harvested at 7–30 days post-injury (DPI) depending on the experiments. i HE staining of the TA muscle cross-sections of FoxM1-cKO mice compared with control mice at 7 days and 14 DPI. Scale bar, 100 μm. j Average CSA of TA muscle in mice at 14 DPI (n = 5). Error bars represent the means ± SD. **p < 0.01, ***p < 0.001; Student’s t test.

